The Hidden Cost of Poor Quality Market Data in Financial Operations
Financial teams across investment banks, asset management firms, and corporate treasury departments share a common, yet frequently overlooked challenge: the devastating impact of poor quality market data on strategic decision-making. When treasury analysts at multinational corporations rely on inconsistent FX data feeds, they unknowingly expose their organizations to millions in unnecessary risk. Similarly, portfolio managers attempting to navigate volatile markets with incomplete or stale data find themselves making critical allocation decisions based on a distorted view of reality.
Meanwhile, liquidity managers at regional banks juggle regulatory compliance requirements while attempting to optimize capital deployment – all while questioning if their underlying market data can be trusted. The financial consequences of these inefficiencies aren’t merely operational; they directly impact bottom-line performance through suboptimal hedging decisions, misaligned investment strategies, and inefficient capital allocation.
In today’s complex financial landscape, your market data isn’t just another input – it’s the foundation upon which your entire decision framework rests. And as the old trading floor saying goes: “Feed your models garbage data, and they’ll reward you with garbage decisions – just much faster than before.”
Reimagining Financial Market Data Management Through Integrated Analytics
Our Market Data Analysis Dashboard represents a paradigm shift in how financial institutions handle, validate, and extract value from their market data assets. By tackling the fundamental challenges of data quality and analytical fragmentation, we’ve created a comprehensive solution that transforms raw market information into actionable intelligence.
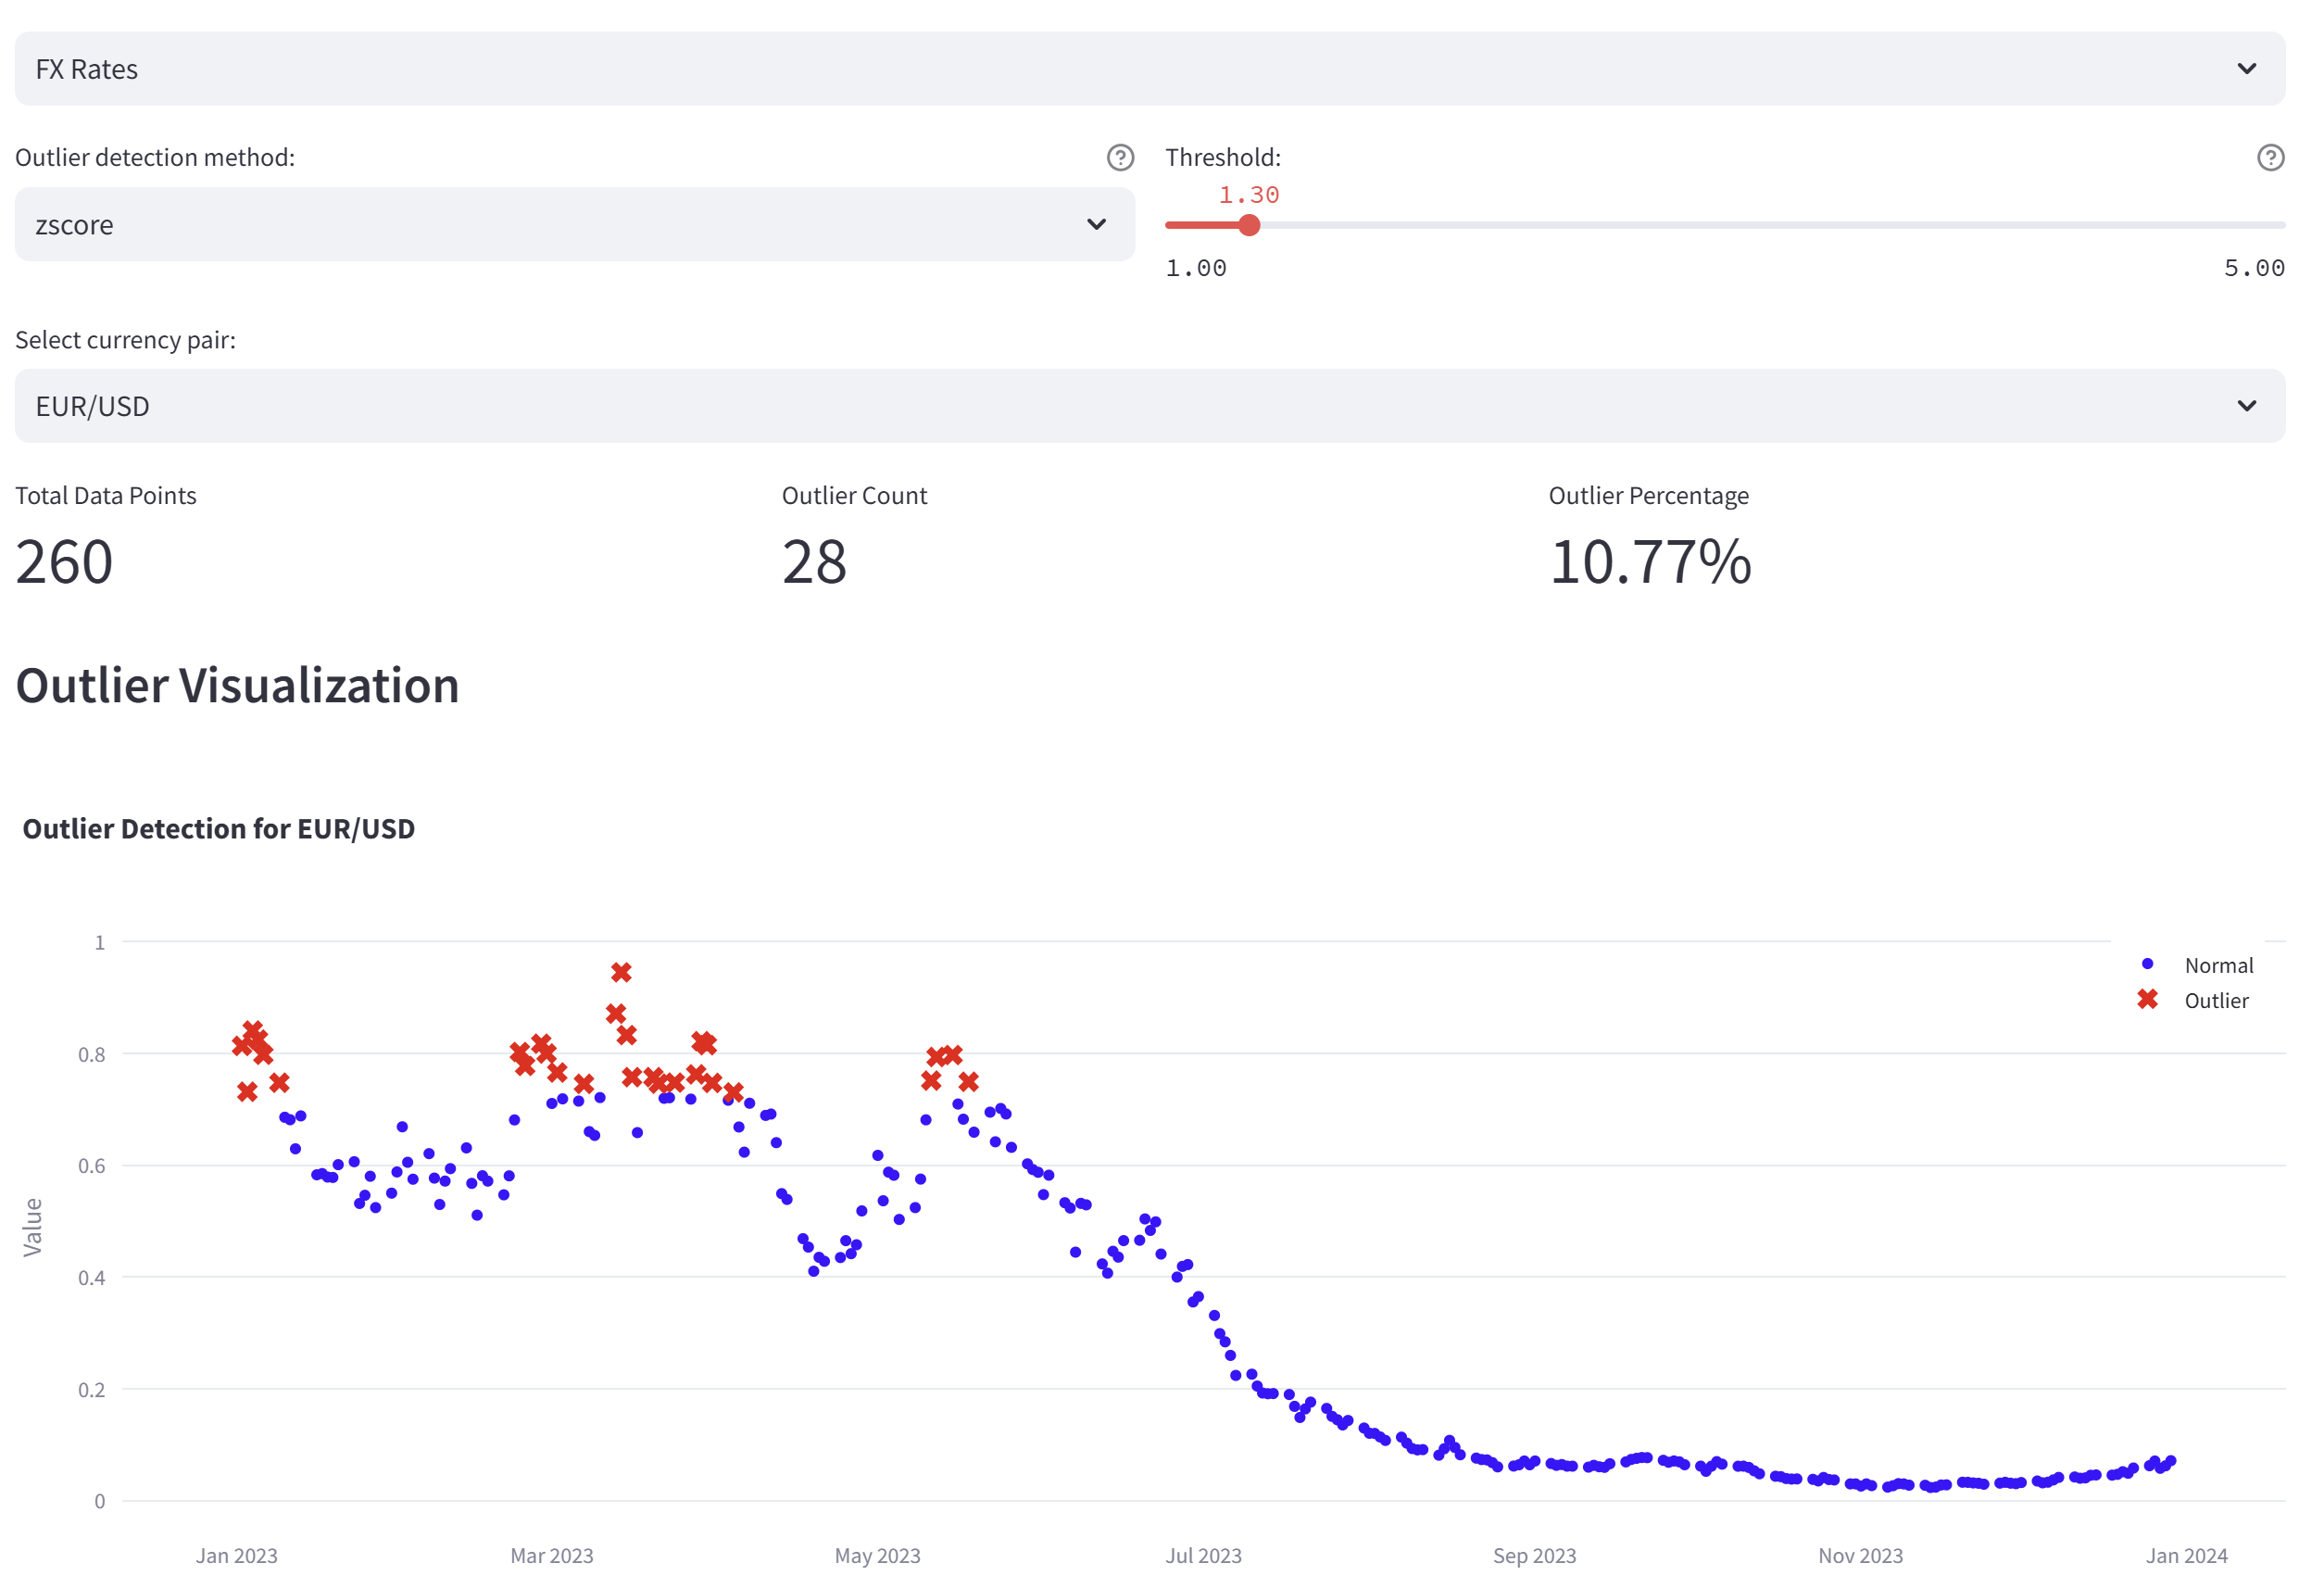
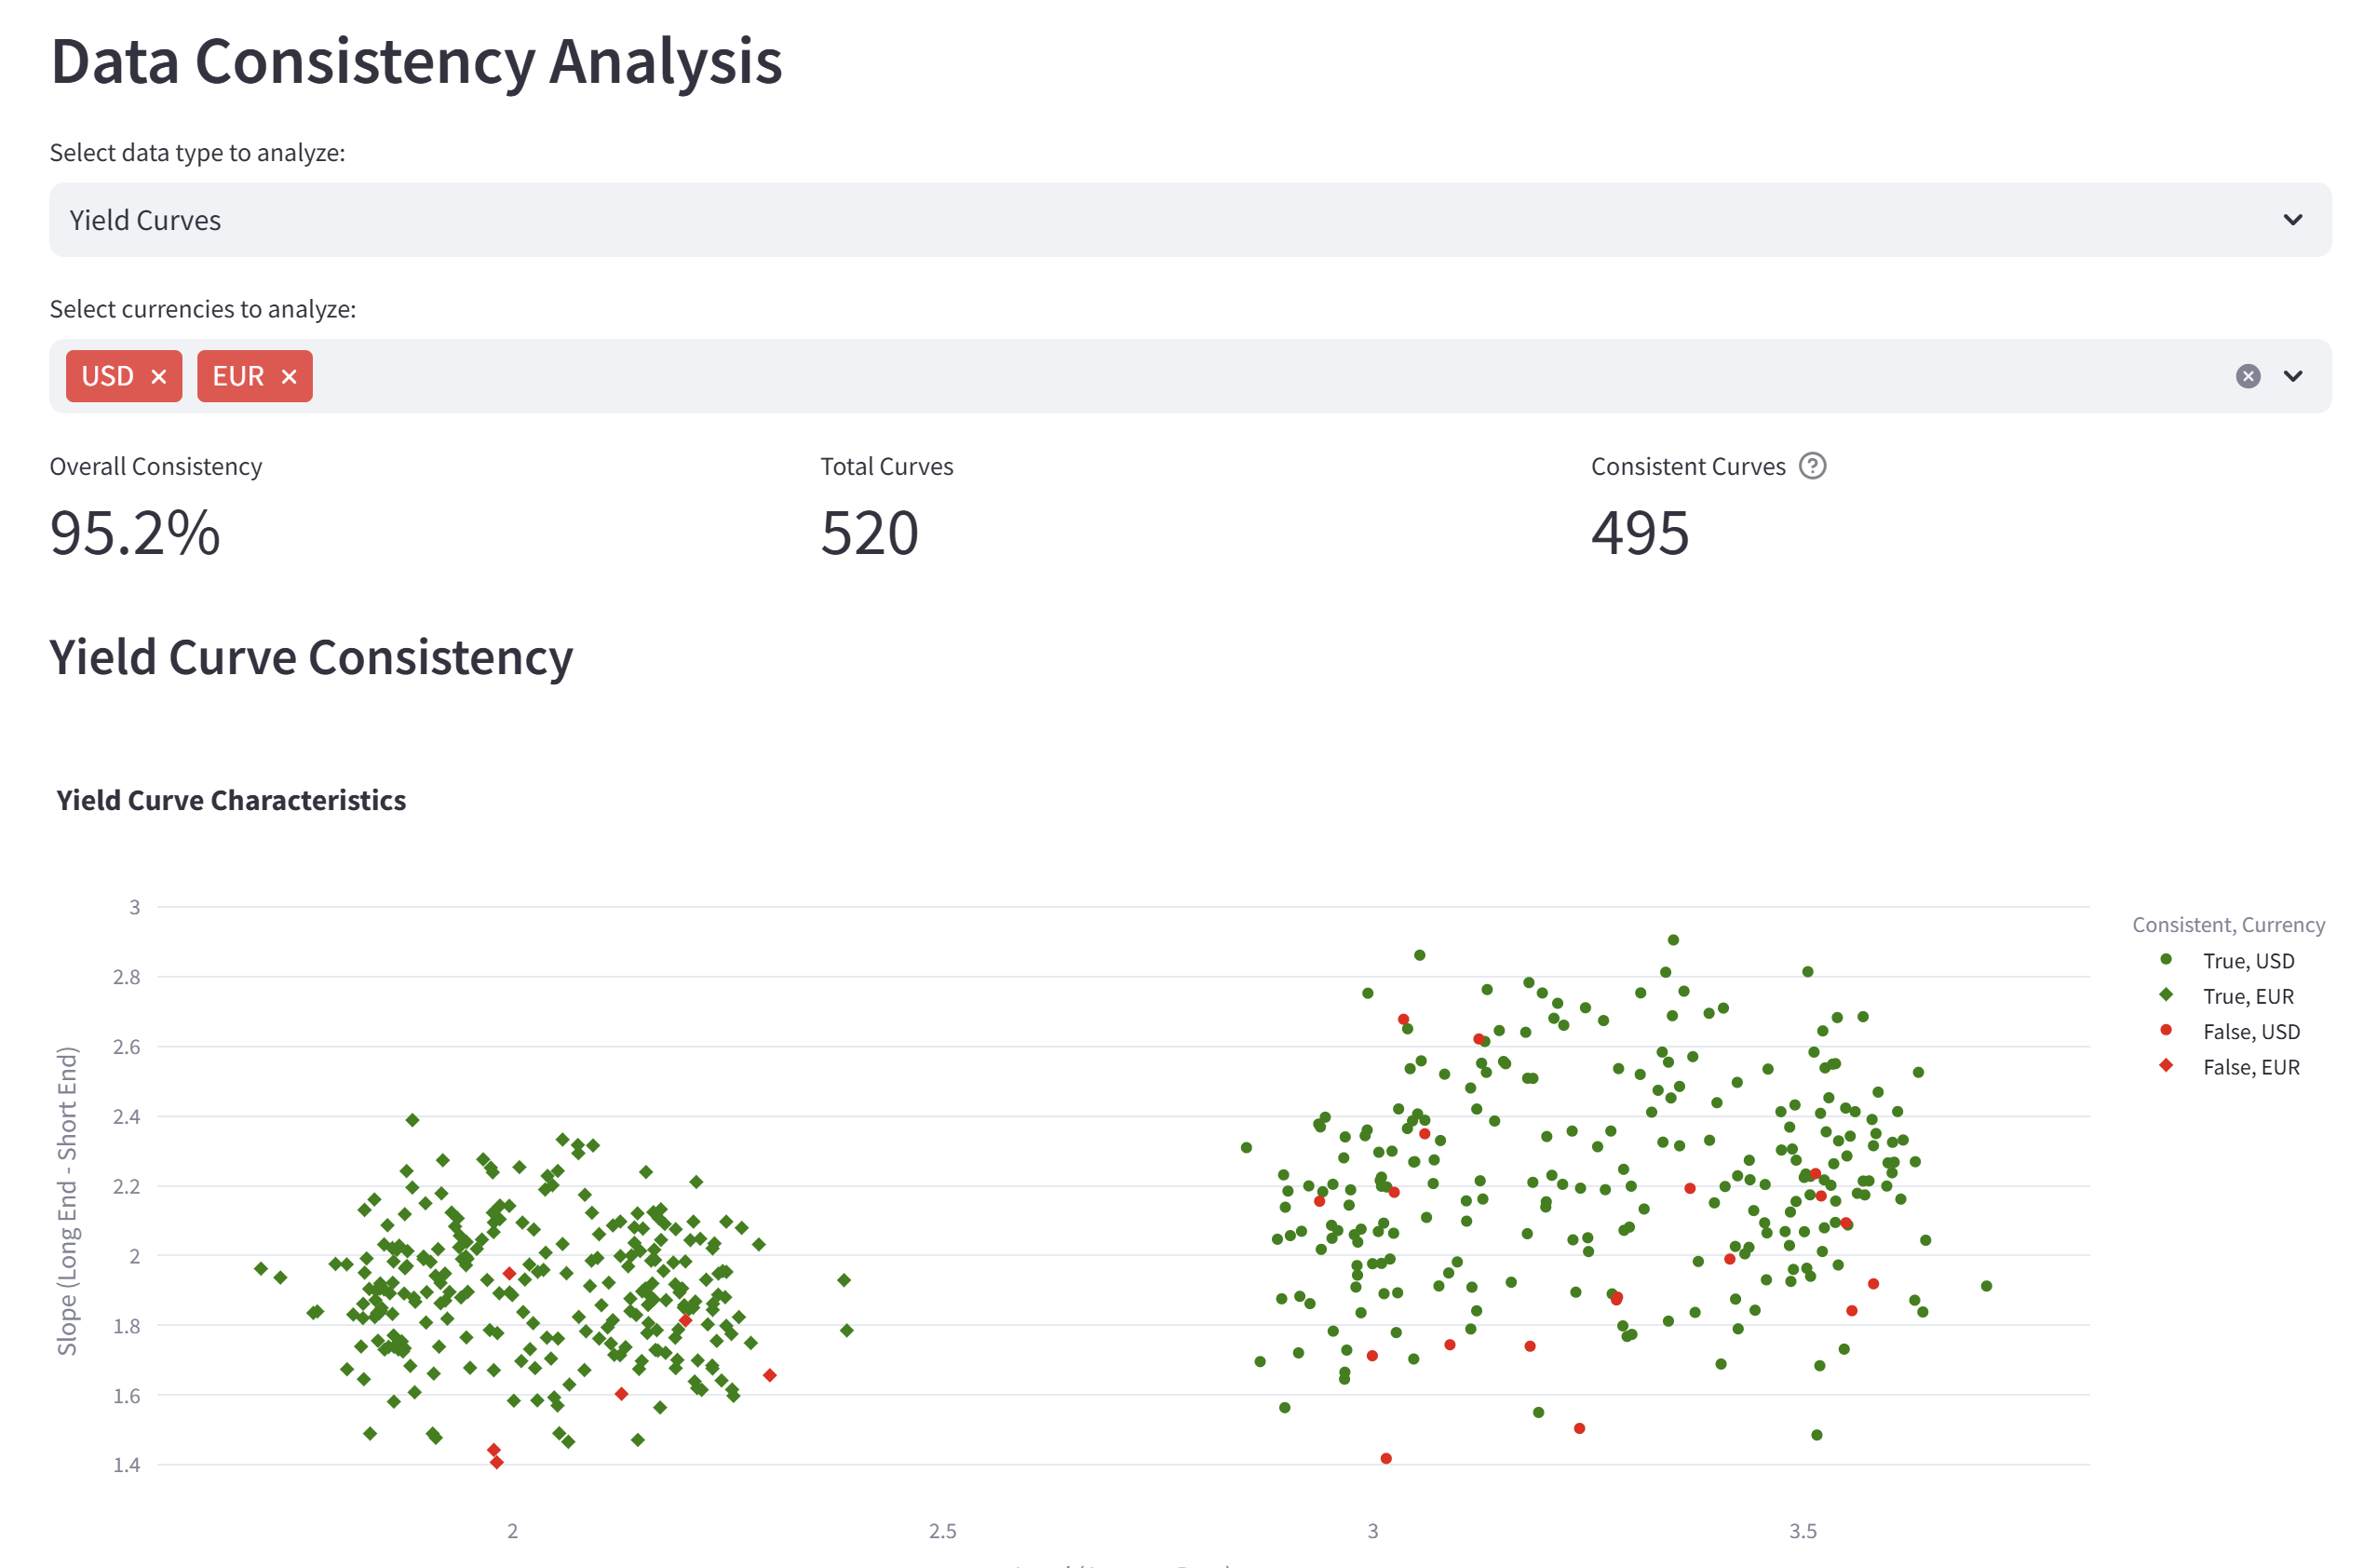
The platform’s Market Data Quality Analysis module forms the cornerstone of this transformation, employing sophisticated algorithms to assess data completeness, identify outliers, and flag inconsistencies across multiple data sources. The system continuously monitors data freshness, ensuring that decisions are made with the most current information available. Through advanced time series visualization, users can instantly identify gaps and anomalies that might otherwise remain hidden in traditional tabular formats.
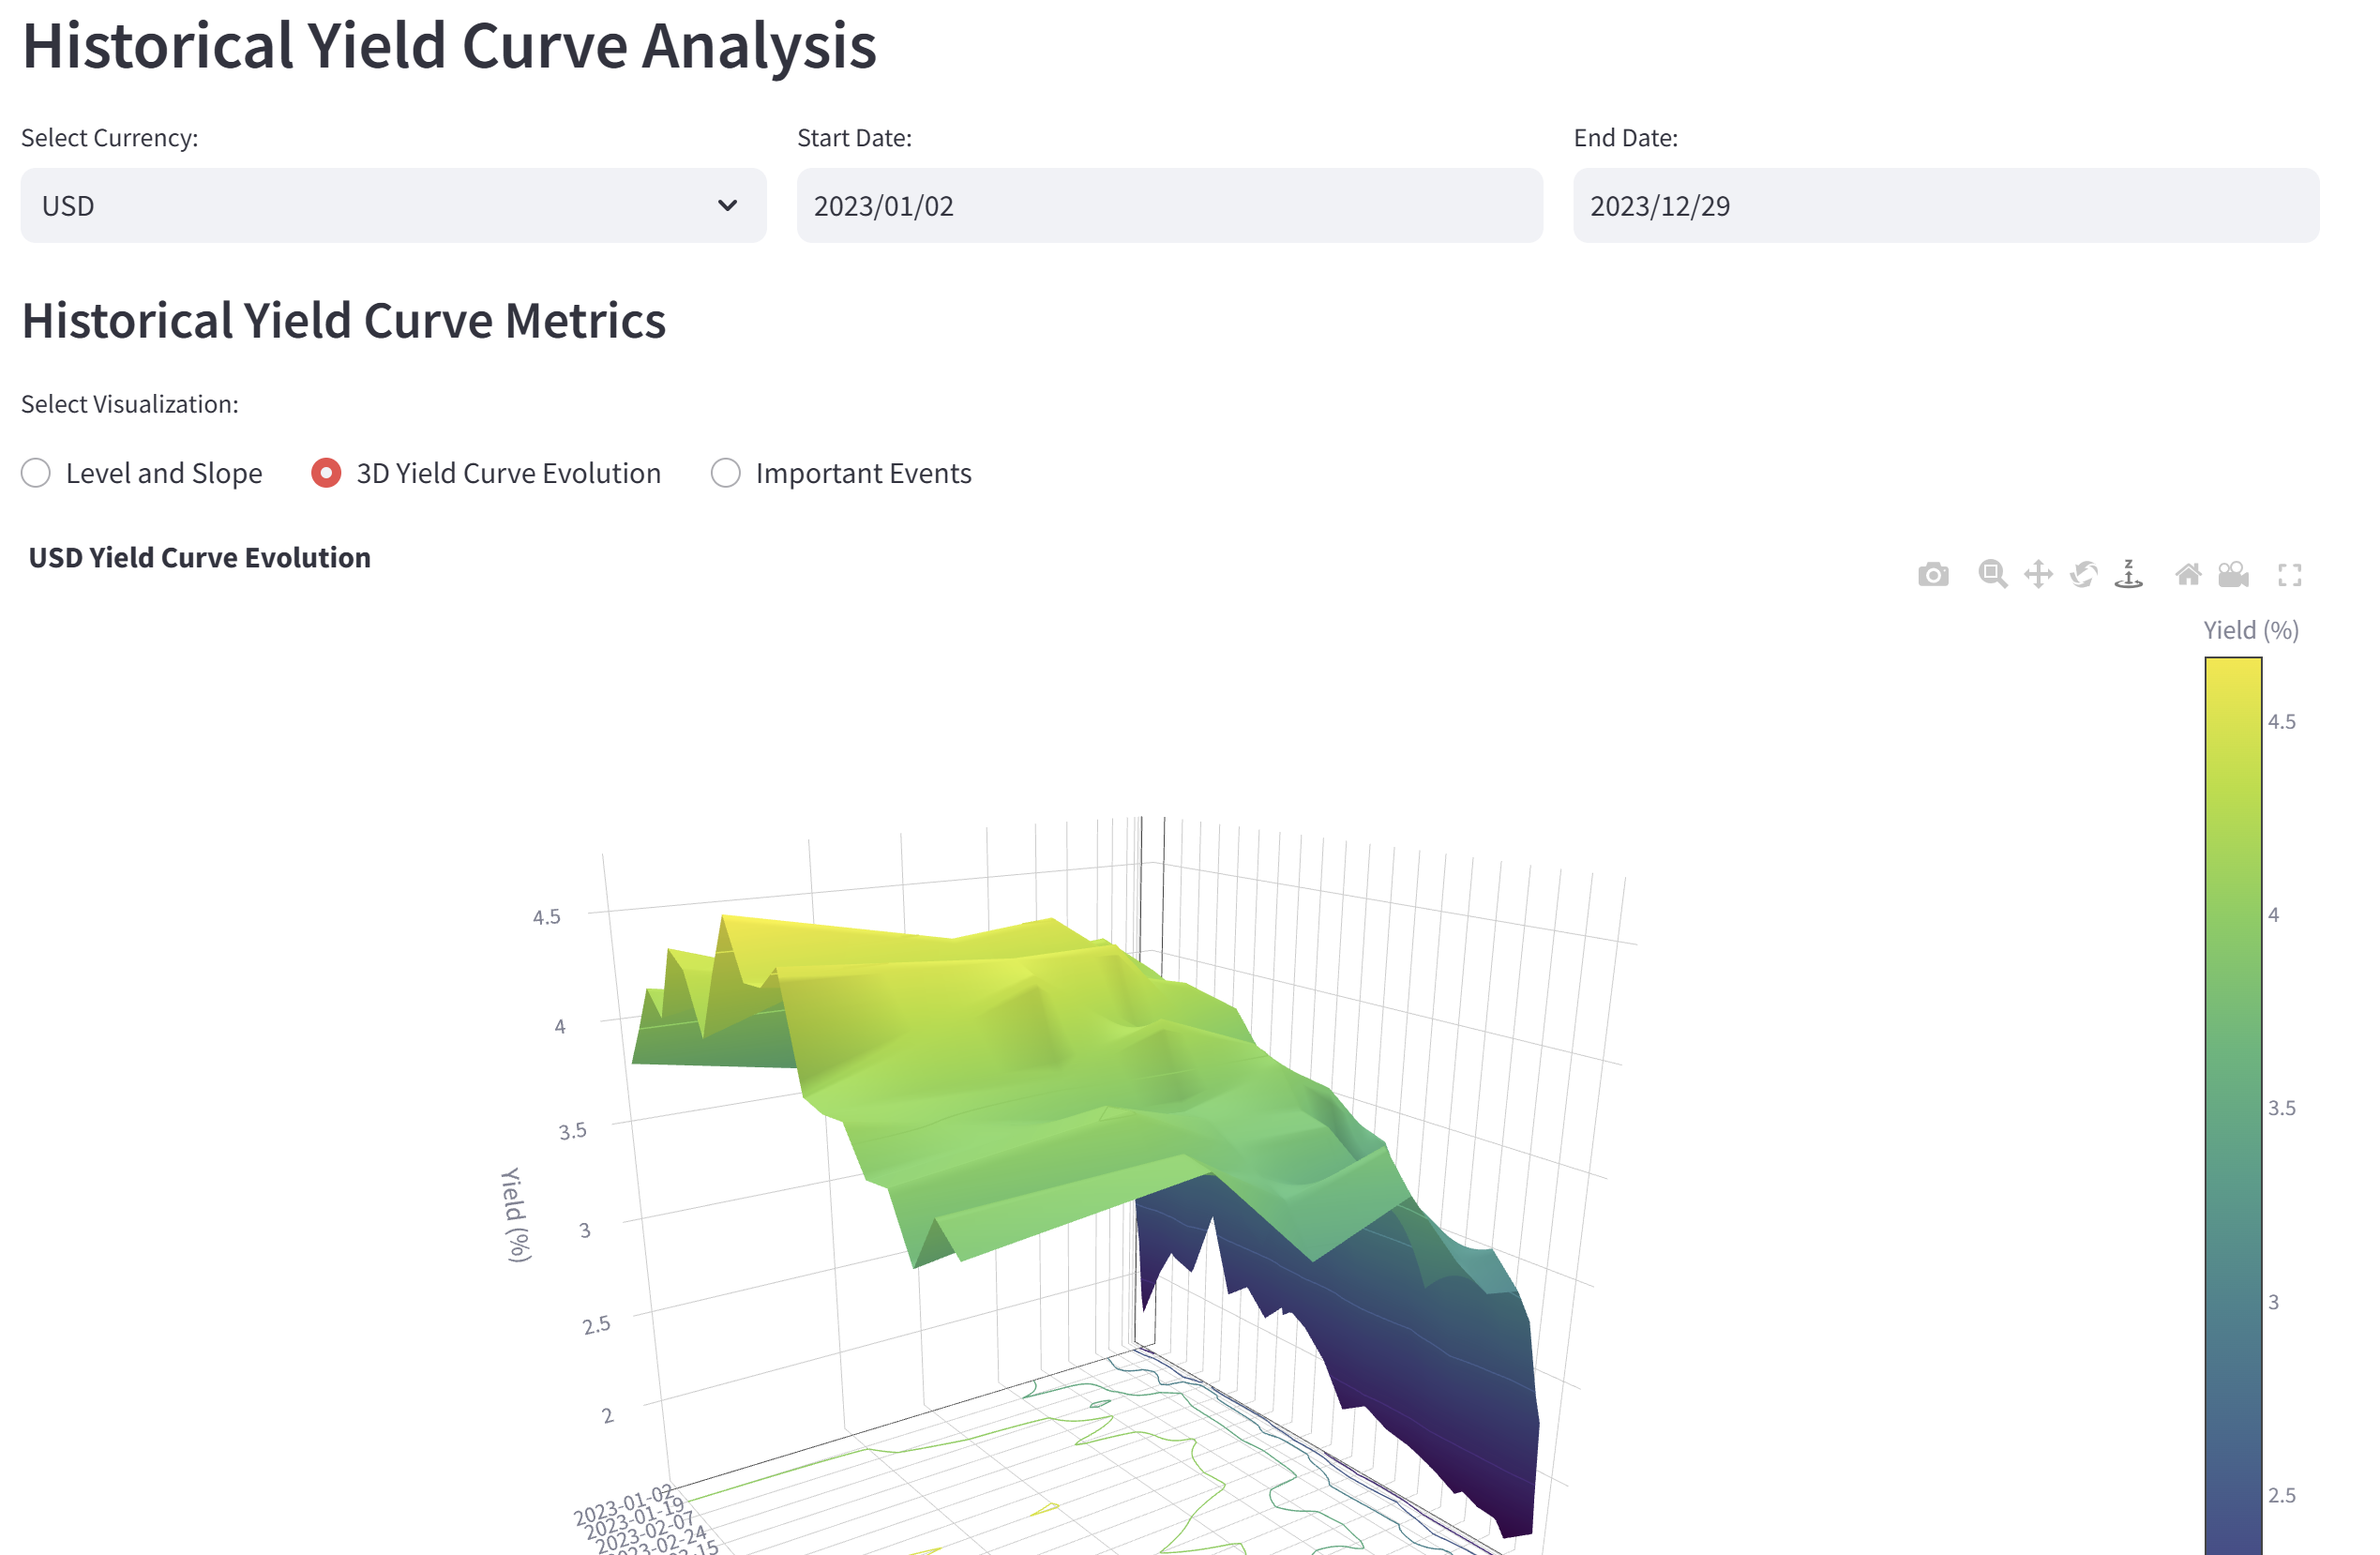
For treasury professionals, our Yield Curve Analysis functionality eliminates the complexity traditionally associated with curve construction and interpretation. The automated financial data quality control procedures ensure that curve inputs meet rigorous standards before analysis begins. Users can visualize curve evolution through intuitive 3D representations, explore forward rates, and conduct sophisticated term premium analysis—all within a single integrated environment. The yield curve analysis automation tools enable scenario modeling capabilities that were previously available only to the largest financial institutions with dedicated quant teams.
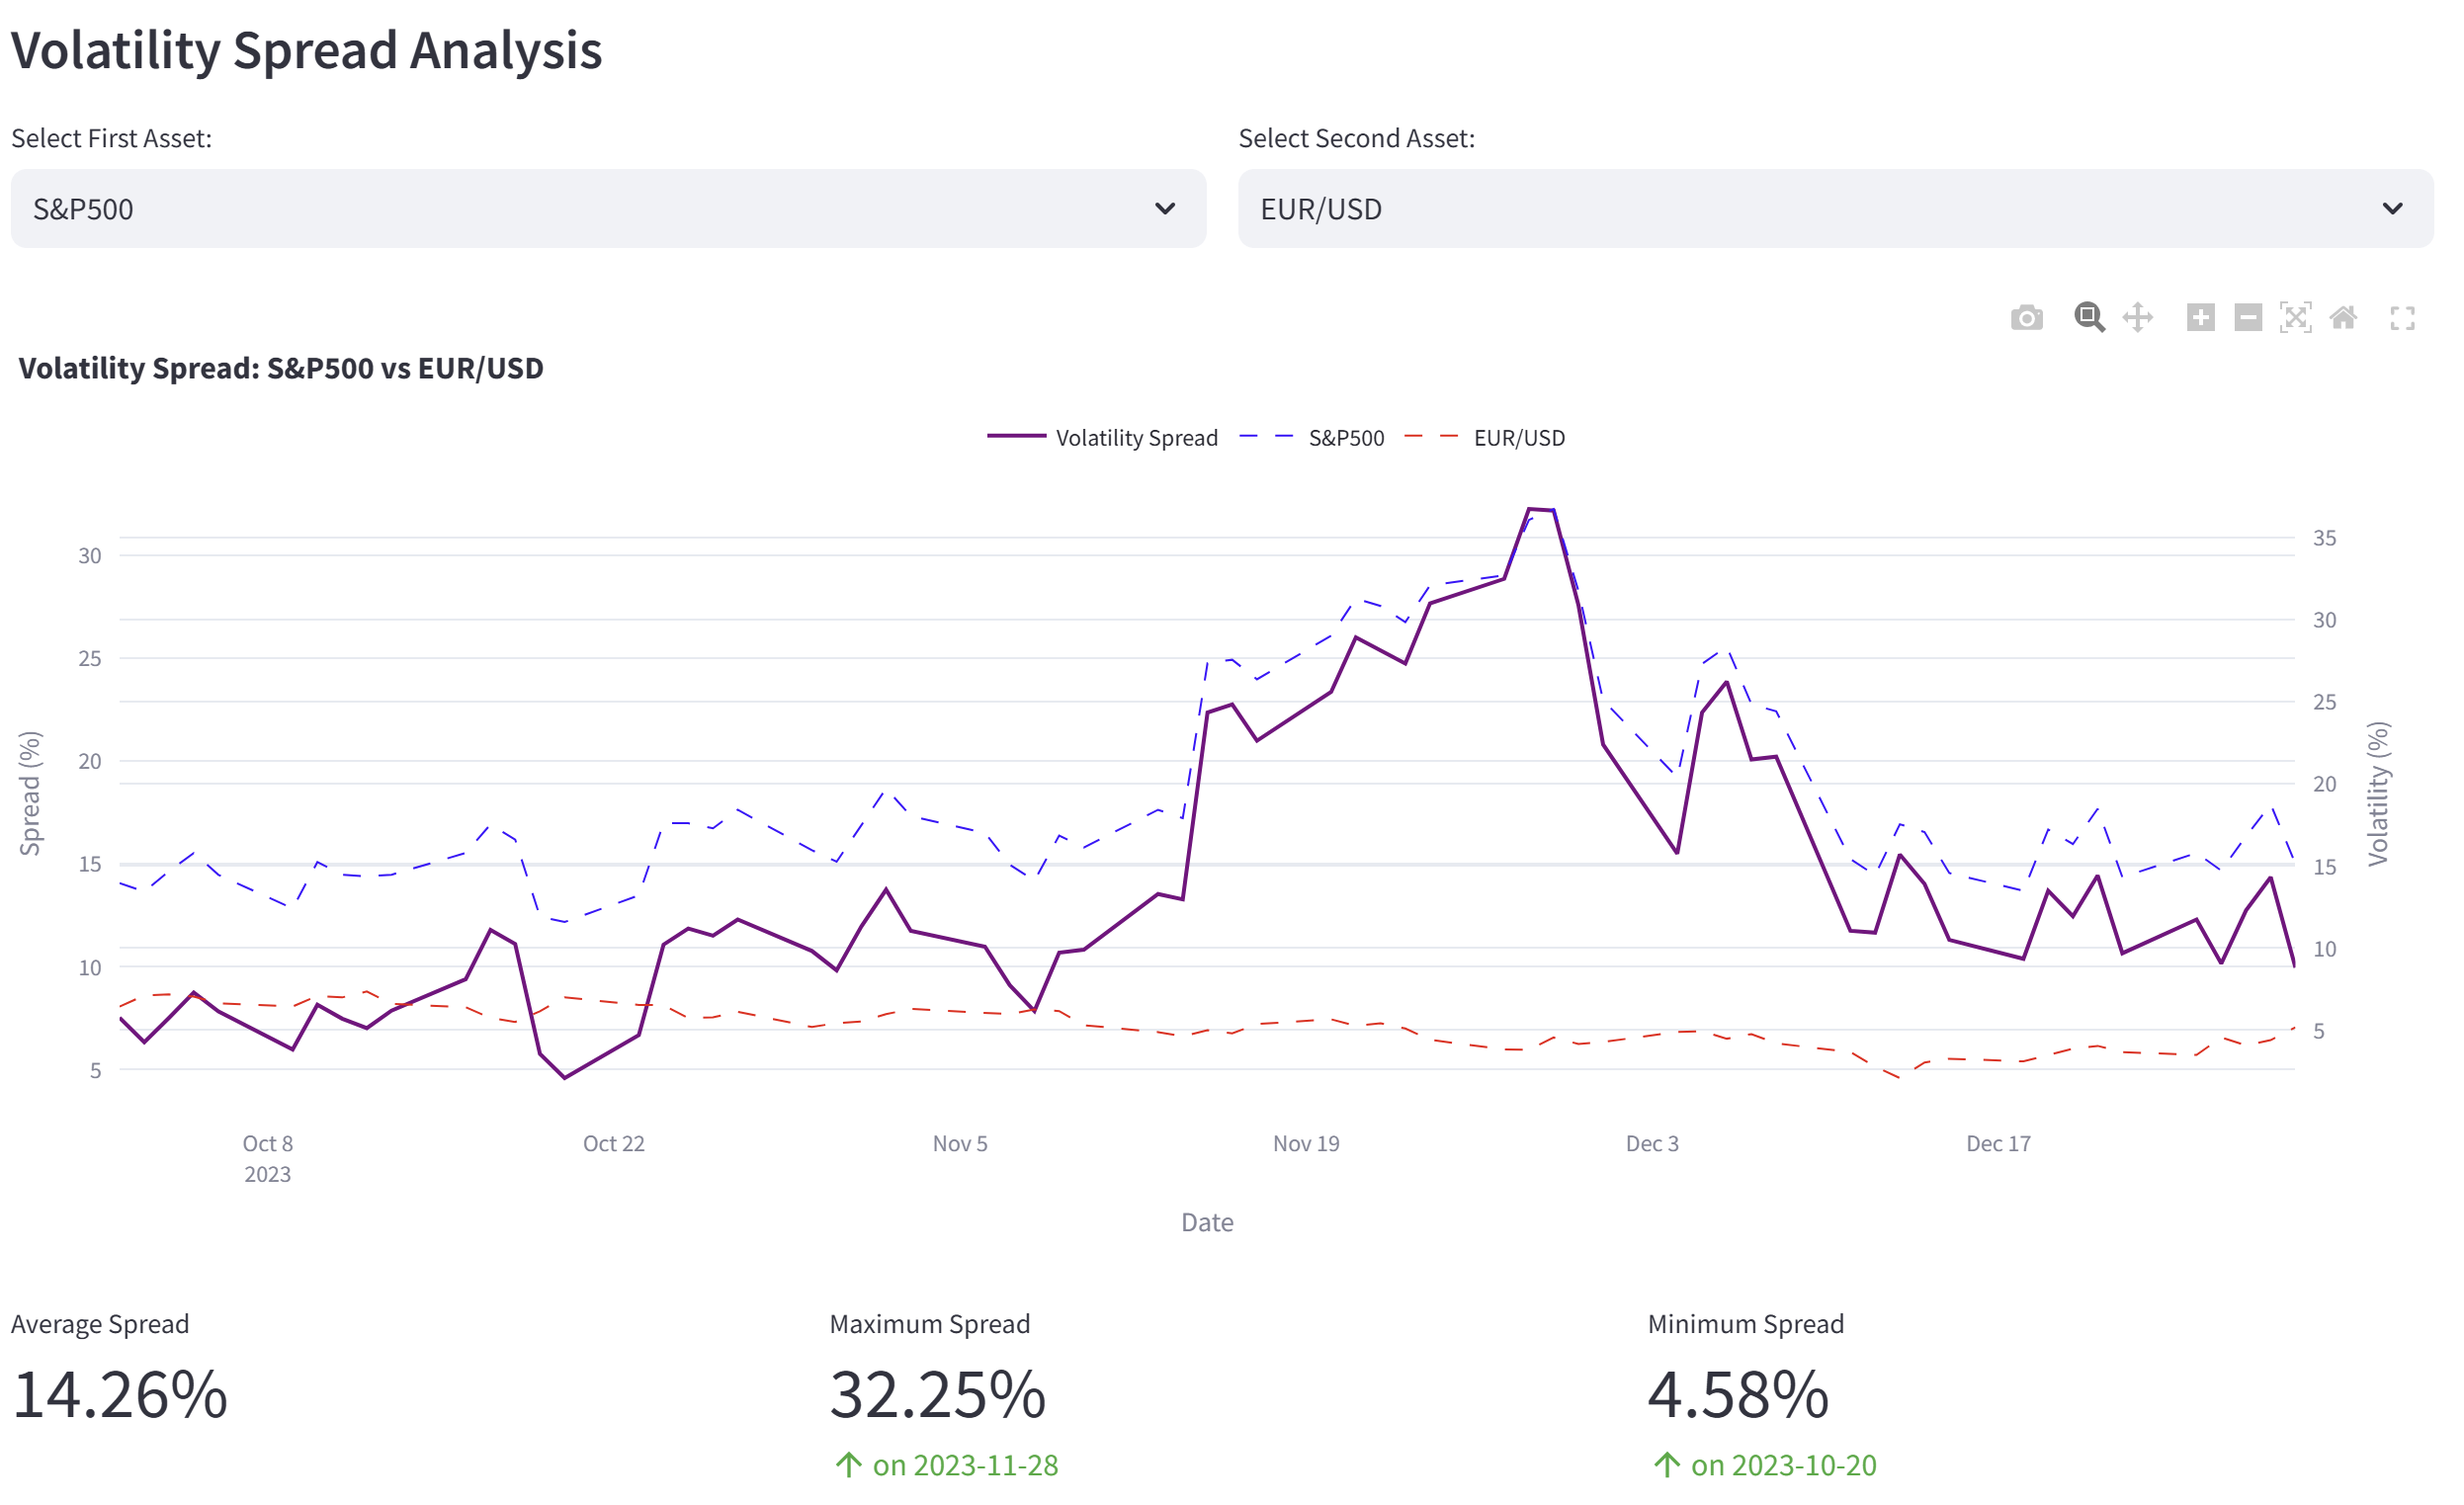
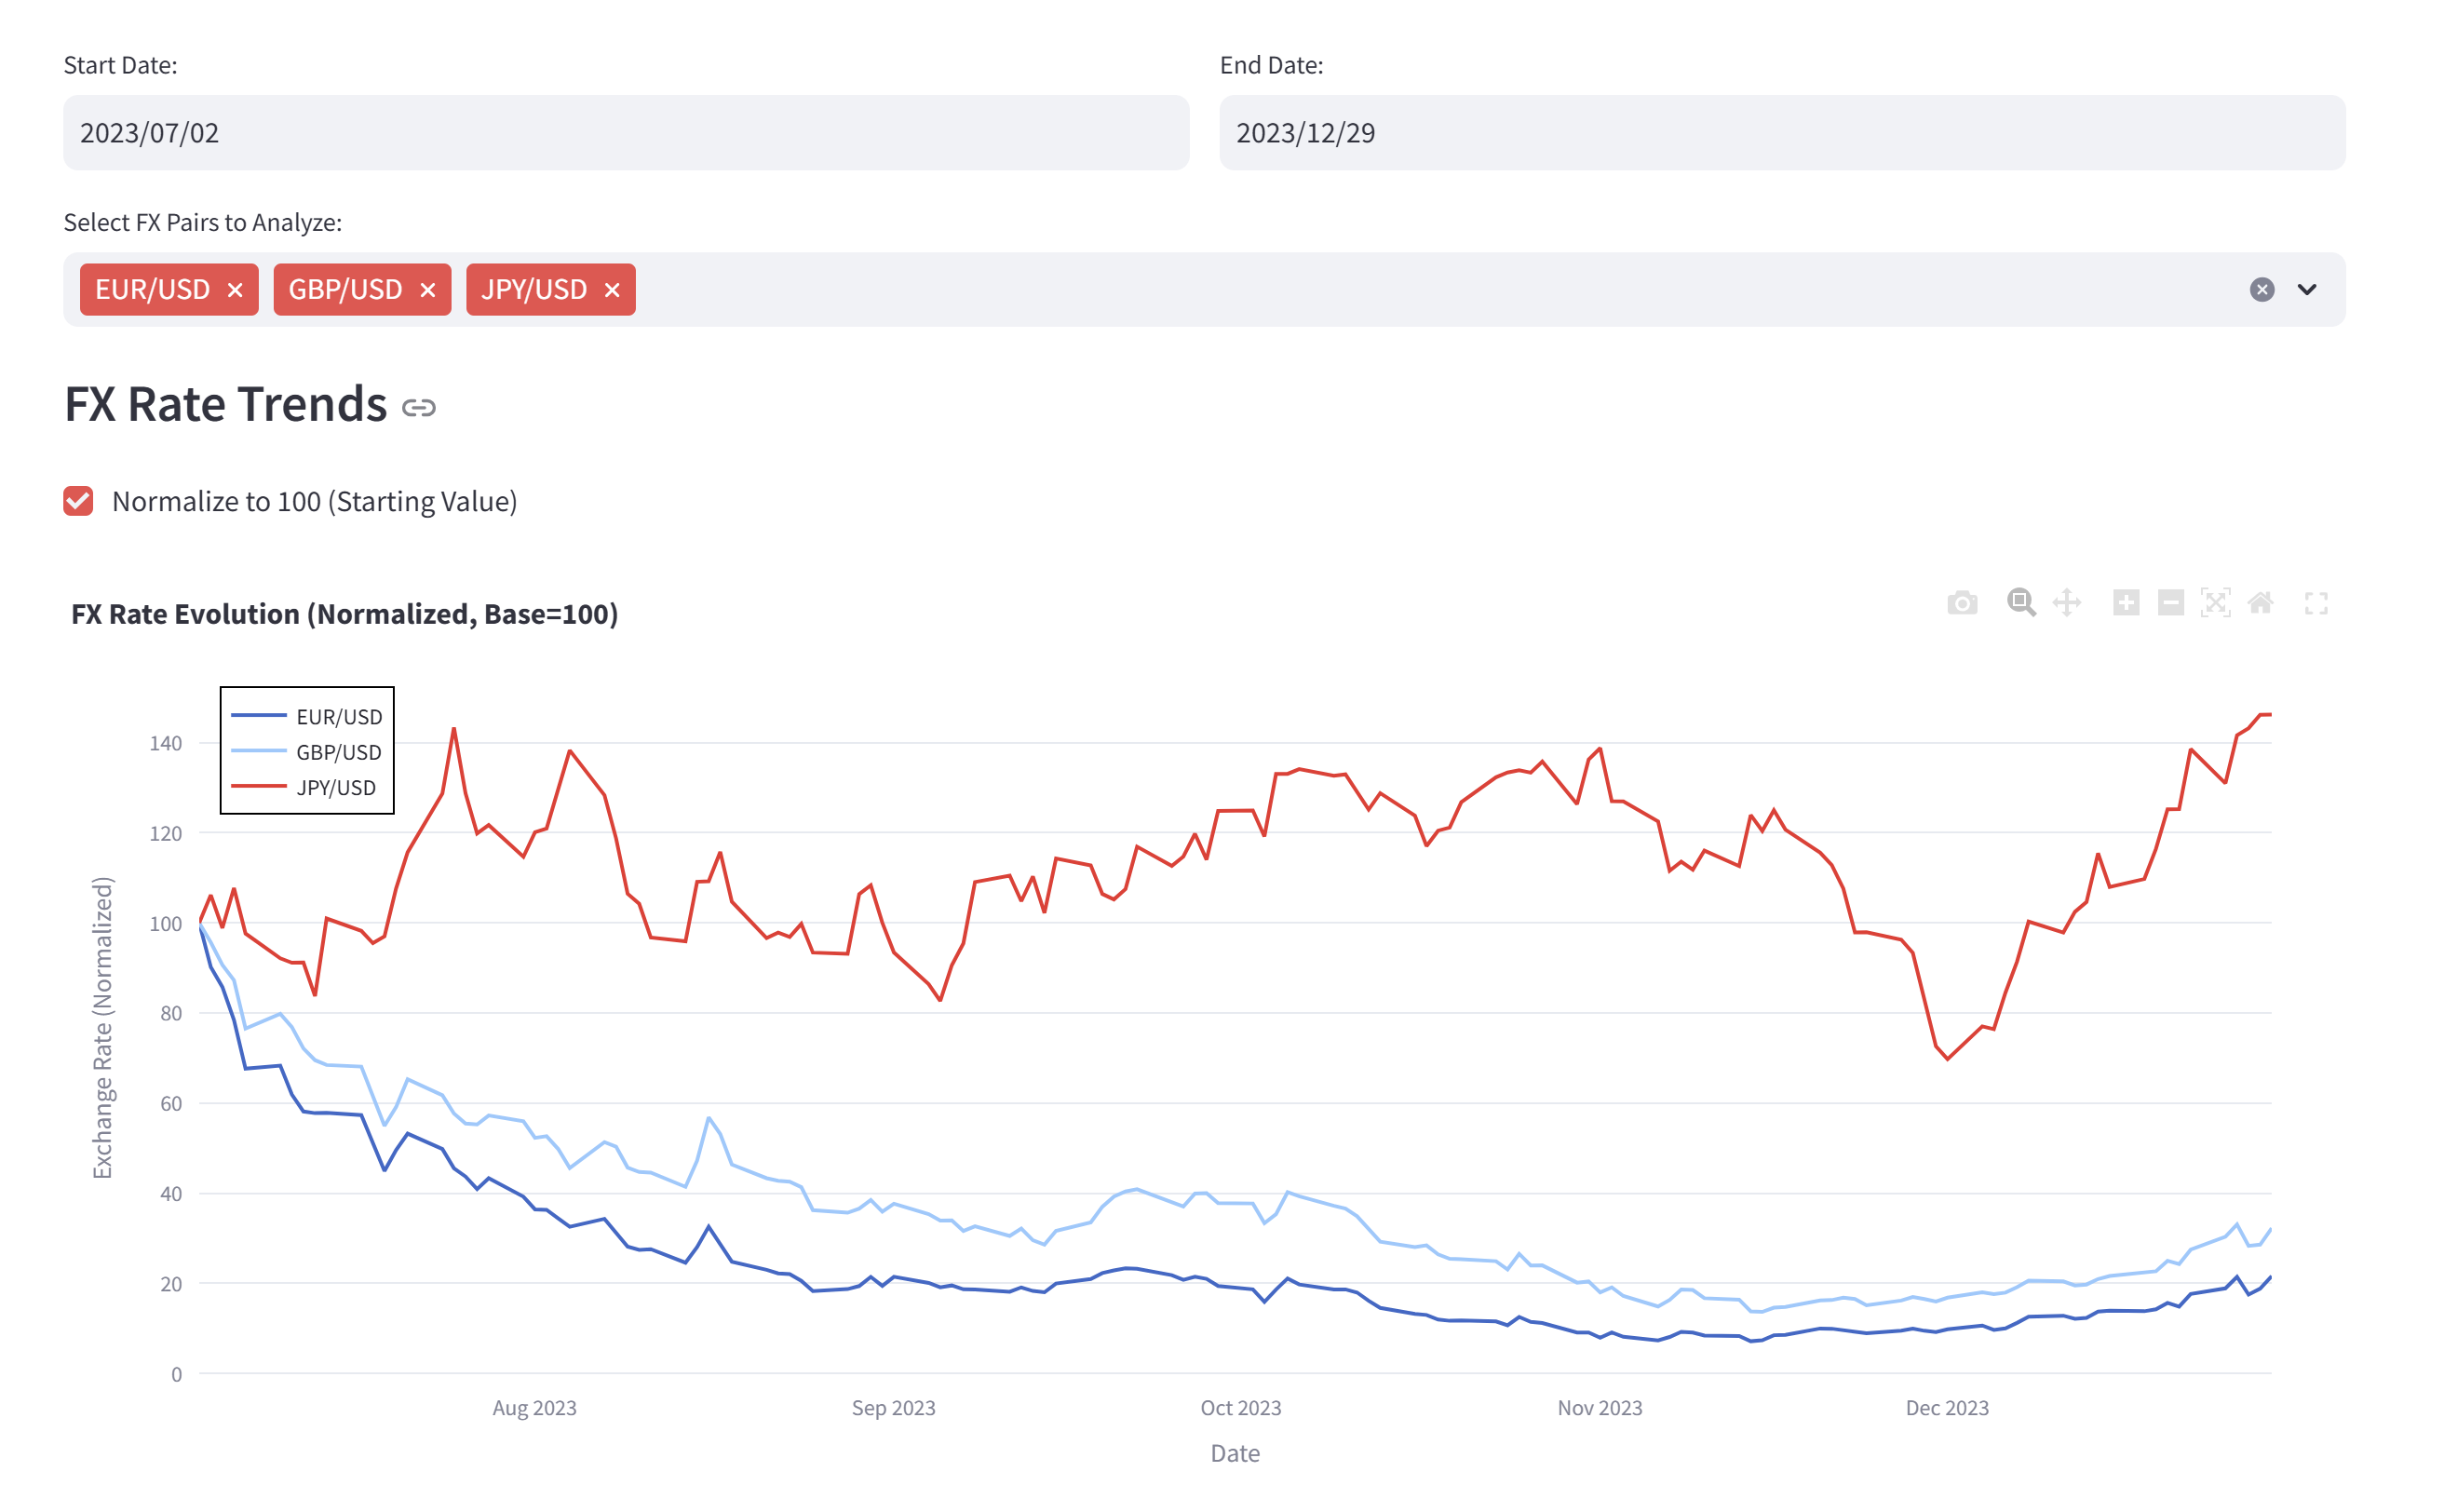
Corporate treasury departments will find particular value in the FX Risk Exposure Dashboard, which provides comprehensive visualization of currency exposures across the organization. This tool transforms the process of managing corporate FX risk exposure from a periodic, labor-intensive exercise to a dynamic, real-time monitoring capability. The system’s volatility analysis components provide early warning indicators of potential market dislocations, allowing for proactive rather than reactive hedging strategies.
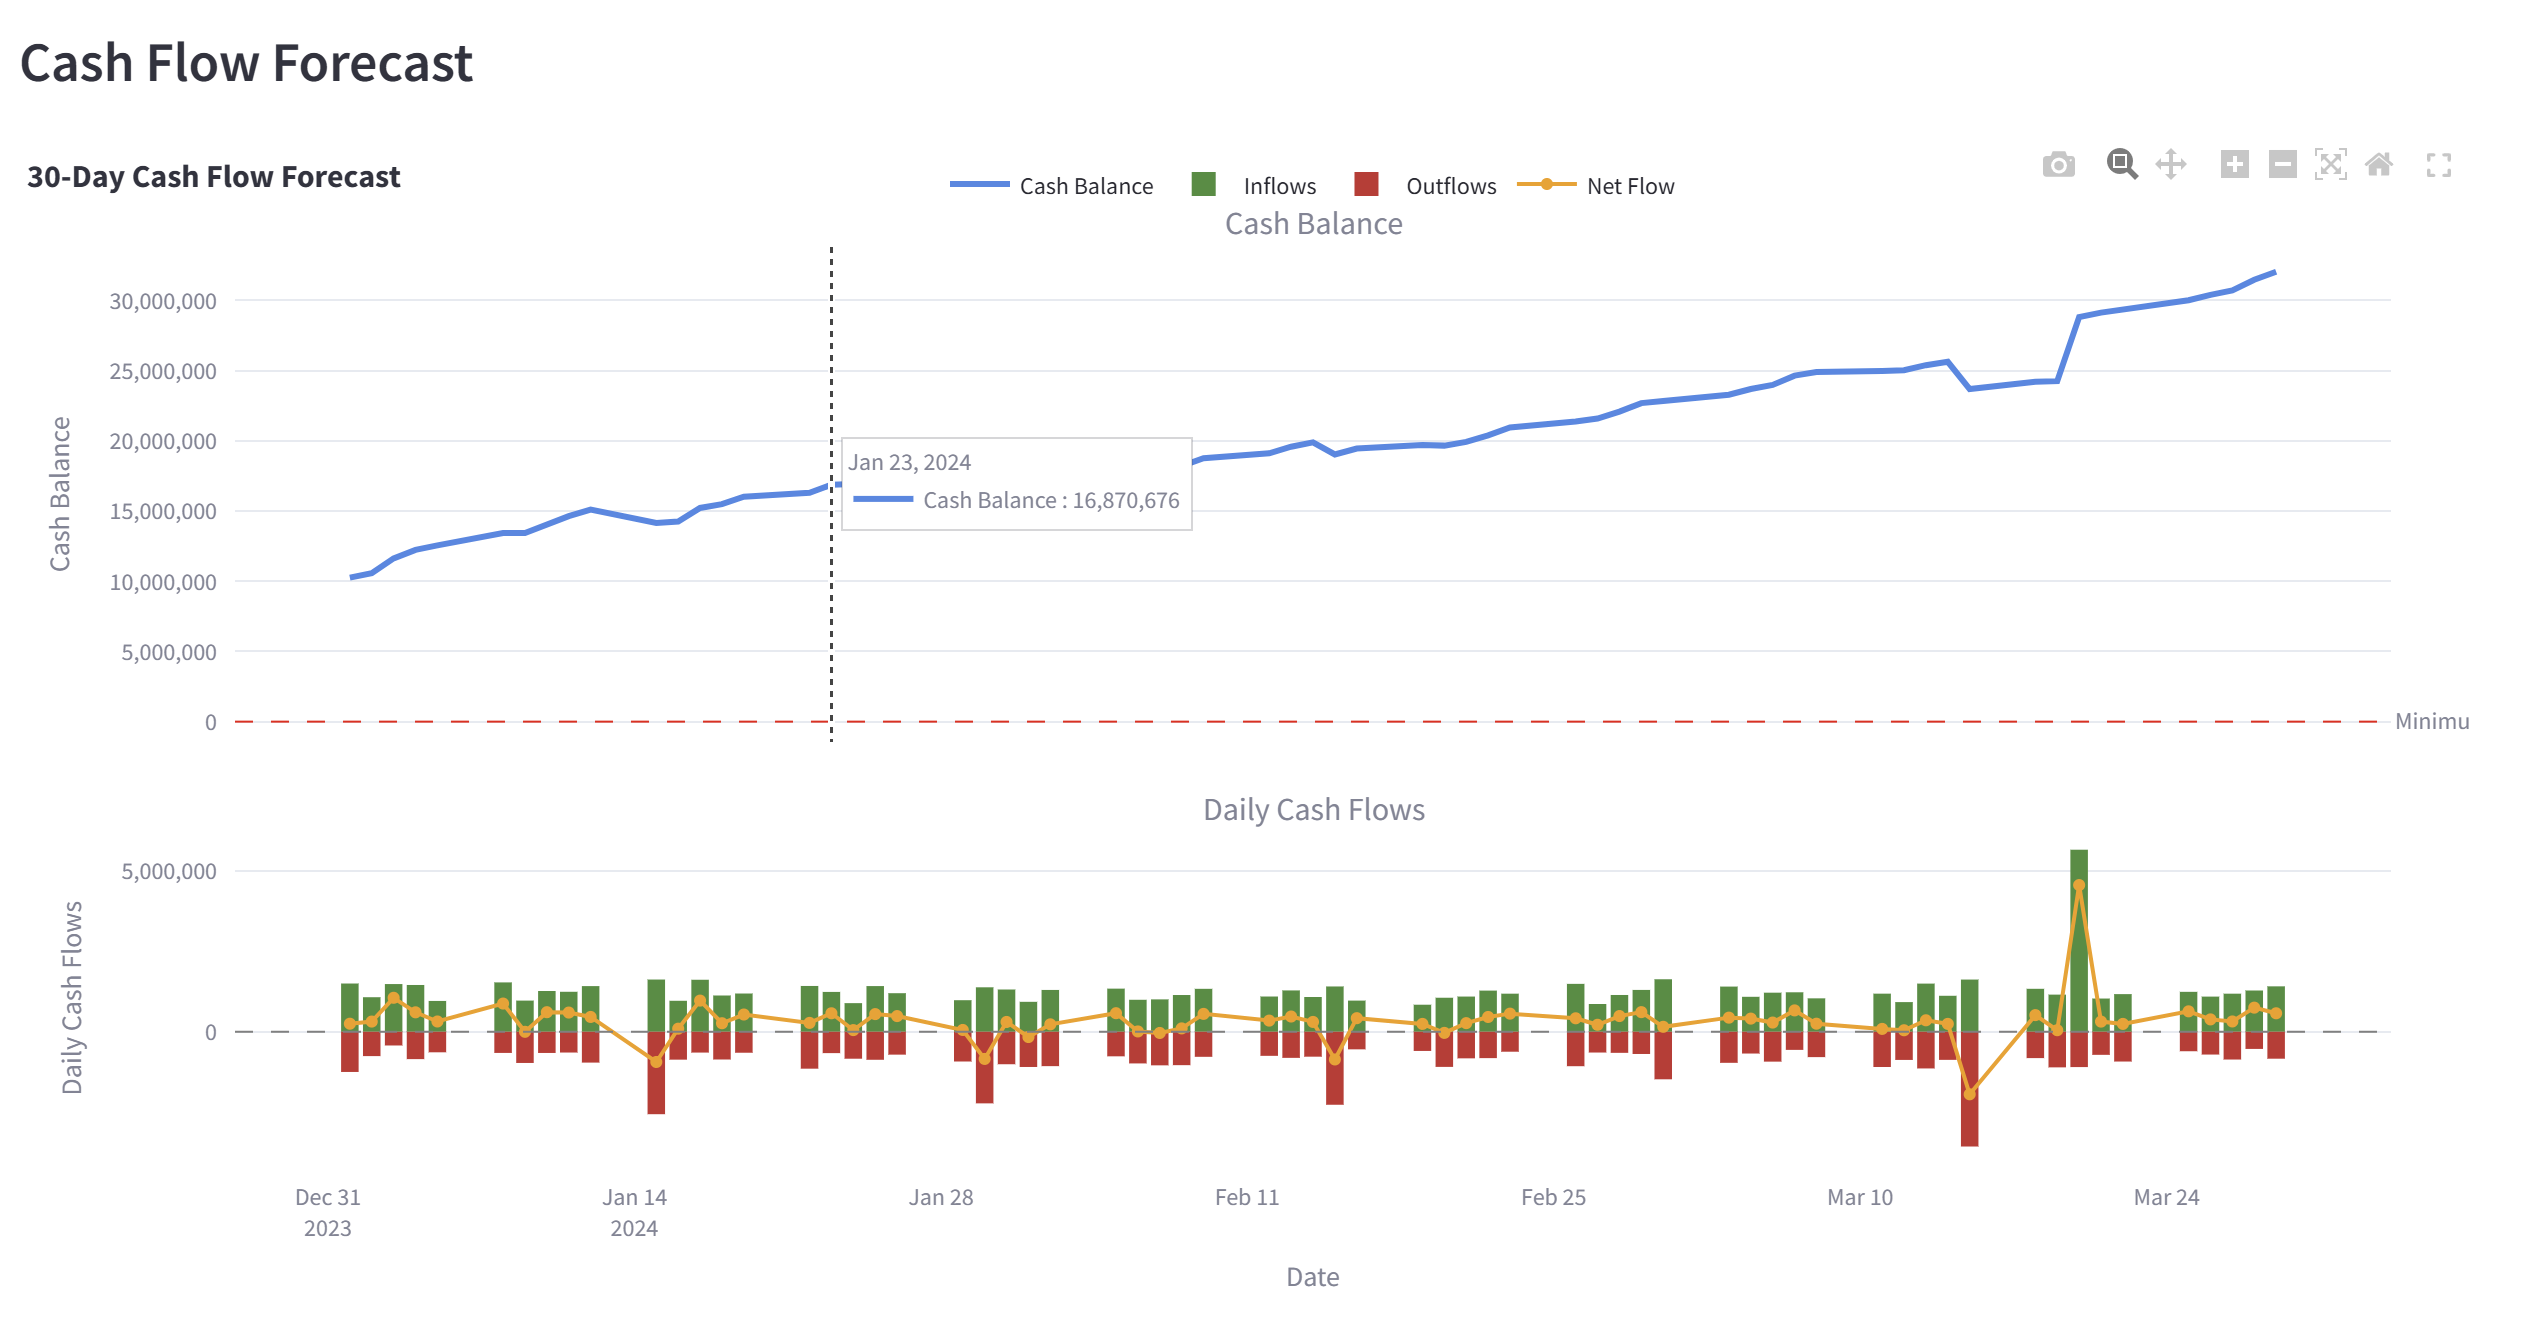
The platform’s Cash Flow and Liquidity Management module addresses the persistent challenges faced by liquidity managers, offering automated forecasting capabilities that incorporate market data quality assessments directly into liquidity projections. This integration ensures that regulatory compliance calculations are based on validated inputs, substantially reducing the risk of reporting errors.
Perhaps most innovative is the Market Volatility Monitor, providing real-time cross-asset volatility monitoring across equity, fixed income, commodity, and currency markets. The system’s correlation analysis capabilities identify regime shifts and changing market dynamics that might impact diversification strategies or risk exposures.
All these capabilities are delivered through a secure, authenticated environment with flexible data exchange options including drag-and-drop interfaces, SFTP connectivity, and API integration. As a managed service, clients are freed from infrastructure concerns, allowing their financial professionals to focus on analysis rather than technology management.
Quantifiable Benefits That Transform Financial Operations
Organizations implementing Market Data Analysis Dashboards have reported significant operational and financial improvements. Users experience meaningful long-term advantages through improved decision quality. The platform’s automated market data validation framework creates a virtuous cycle: better data leads to more accurate models, which produce more reliable forecasts, ultimately resulting in superior financial outcomes. Risk managers report greater confidence in their assessments, while compliance teams appreciate the comprehensive audit trails that document data quality throughout the analytical process.
Perhaps most valuable is the cultural shift that occurs when an organization implements financial data quality monitoring tools. Teams move from questioning their data to leveraging it, from fragmented analytical approaches to integrated decision frameworks, and from reactive crisis management to proactive opportunity identification.
Experience the Difference: Your Personalized Market Data Solution
The most effective way to understand the transformative potential of our Market Data Analysis Dashboard is to experience it with your own data. Unlike generic demonstrations, our personalized approach uses your actual market data feeds, risk exposures, and analytical requirements to showcase relevant capabilities.
The process begins with a brief discovery session where we identify your most pressing market data challenges. Our team then configures a customized version of the platform using your data sources, creating a realistic demonstration environment. This approach allows you to evaluate the solution within your specific context rather than through hypothetical scenarios.
Following the demonstration, you’ll receive a detailed implementation roadmap outlining integration requirements, expected timelines, and projected benefits specific to your organization. As every financial data veteran knows: “A dashboard without your data is just a pretty picture – but with your data, it’s a decision engine.”
Transform Your Market Data from Liability to Strategic Asset Today
Contact us today to schedule your personalized Market Data Analysis Dashboard demonstration. Discover how our integrated platform can eliminate your data quality challenges, streamline your analytical processes, and enhance your financial decision-making capabilities.
By submitting this form, you agree that Finaprins may contact you occasionally via email to make you aware of Finaprins products and services. You may withdraw your consent at any time. For more details see the Finaprins Privacy Policy.
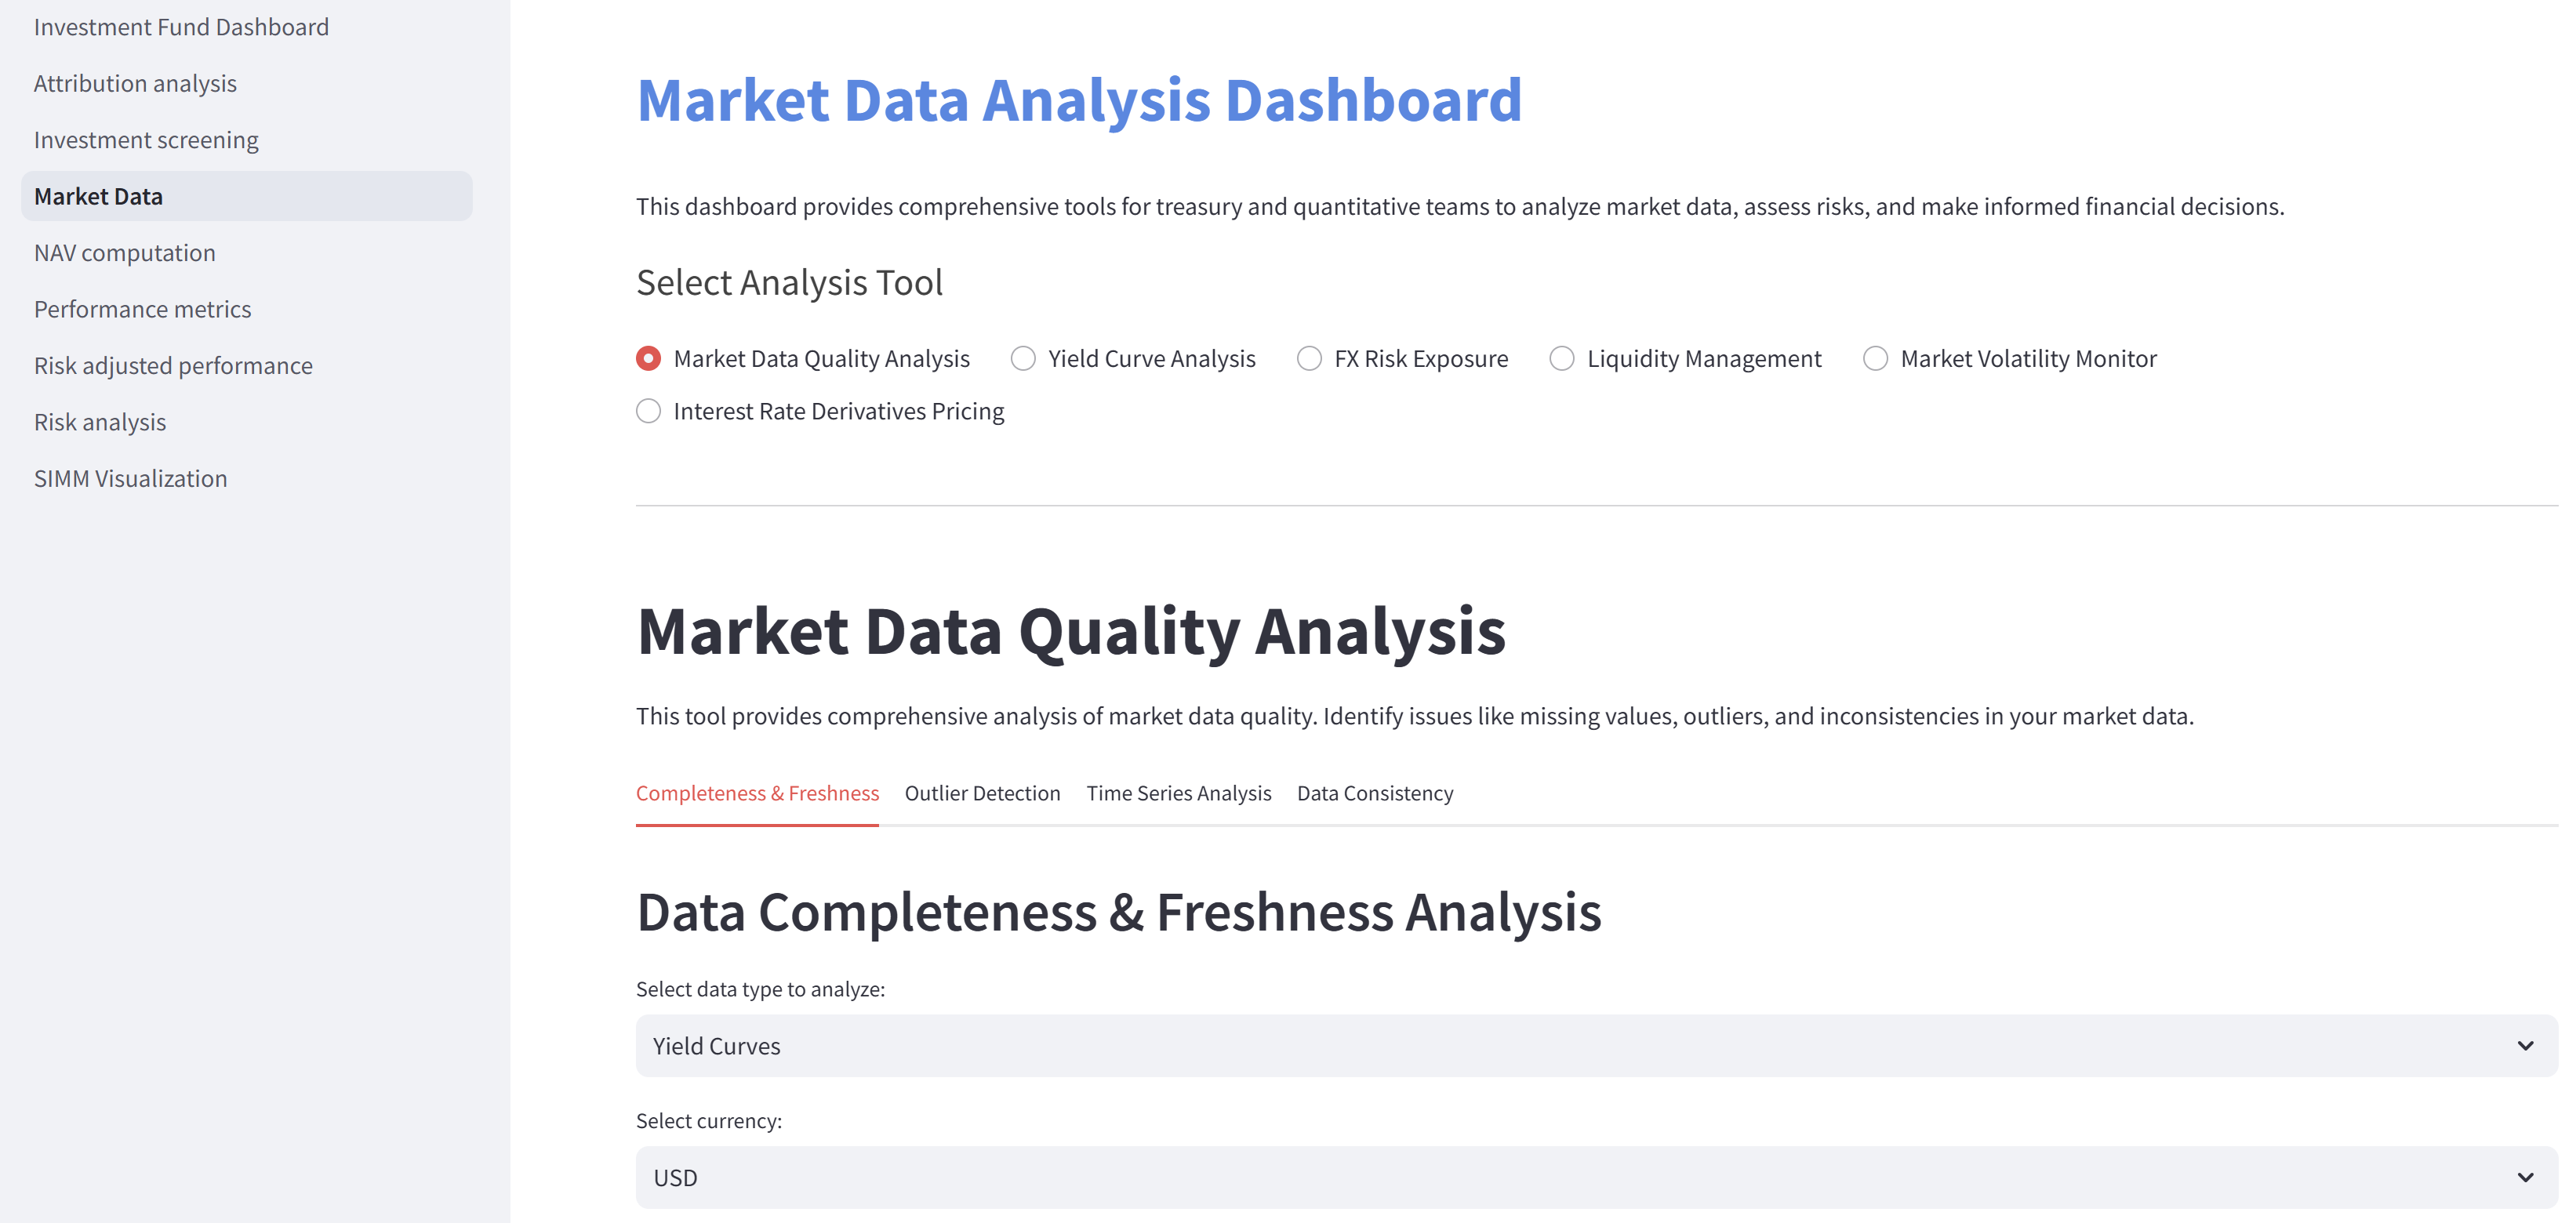
Photo by Erol Ahmed on Unsplash