Financial teams in non-financial companies face a growing crisis of fragmented visibility, preventing timely, accurate decision-making and creating significant operational bottlenecks. Our integrated financial metrics visualization platform addresses this fundamental challenge by connecting disparate data sources into a unified CFO dashboard, delivering real-time insights across all business dimensions. This transformation streamlines reporting processes while dramatically enhancing strategic decision capabilities.
The Hidden Cost of Fragmented Financial Data
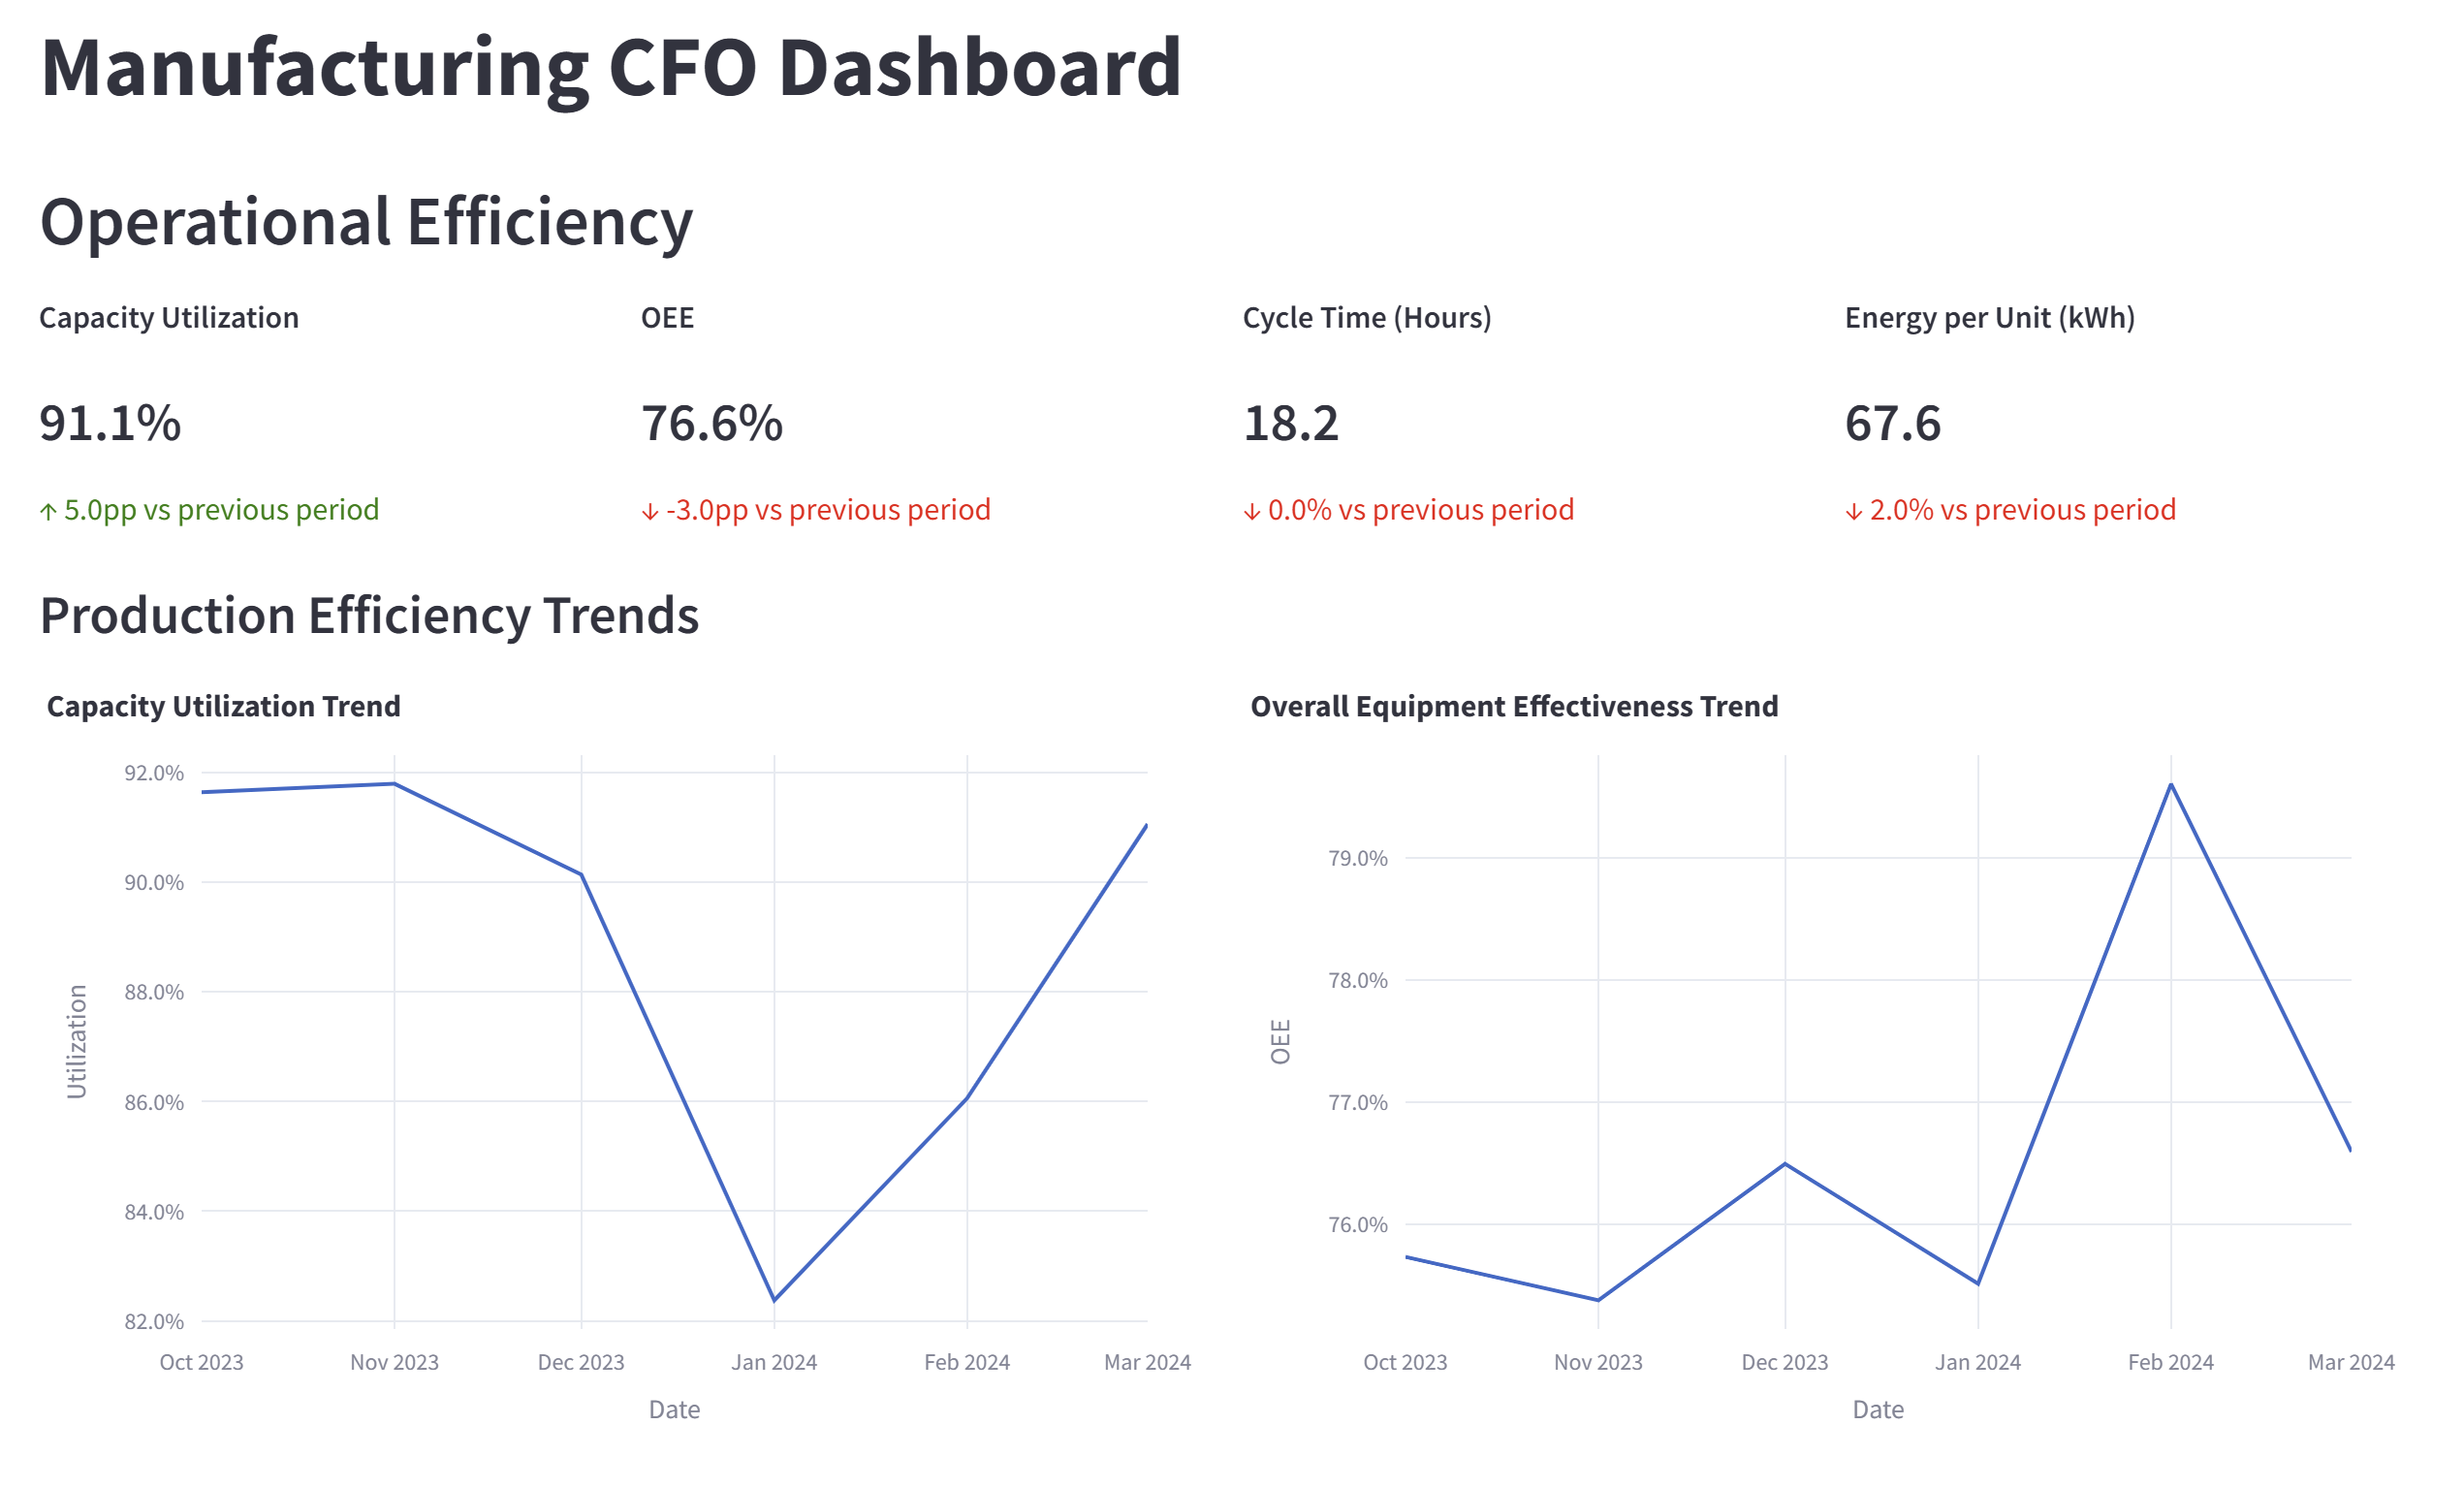
Today’s financial departments operate in increasingly complex environments where data proliferates across multiple systems, departments, and formats. A manufacturing company CFO might need to simultaneously track production costs, inventory valuation, channel profitability, and cash flow projections—each residing in separate systems managed by different teams. This fragmentation creates a persistent challenge that compounds with organizational growth.
Manual financial data consolidation introduces significant error potential while delaying critical reporting cycles. When quarterly business reviews require explaining margin variations, CFOs often lack the integrated view needed to connect inventory costs, pricing decisions, and regional performance factors.
Department leaders face similar frustrations when operational decisions depend on financial context. A retail operations director seeking to understand how store labor costs impact regional profitability may wait weeks for custom reports—by which time the data has lost much of its relevance and actionability. Board members and investors receive inconsistent information, undermining confidence and complicating strategic planning efforts.
The fundamental challenge lies in connecting financial outcomes with their operational drivers in real-time. Without this consolidated view, organizations essentially navigate with a rearview mirror, making decisions based on outdated information while competitors leverage integrated systems for faster response. When your financial data moves slower than your market, you’re essentially bringing spreadsheets to a dashboard fight.
Reimagining Financial Visibility Through Unified Dashboards
Our solution addresses these challenges through a comprehensive unified financial performance dashboard designed specifically for non-financial companies. This platform integrates data from disparate financial systems into a single, coherent view tailored to different organizational contexts.
Key Performance Indicators Integration
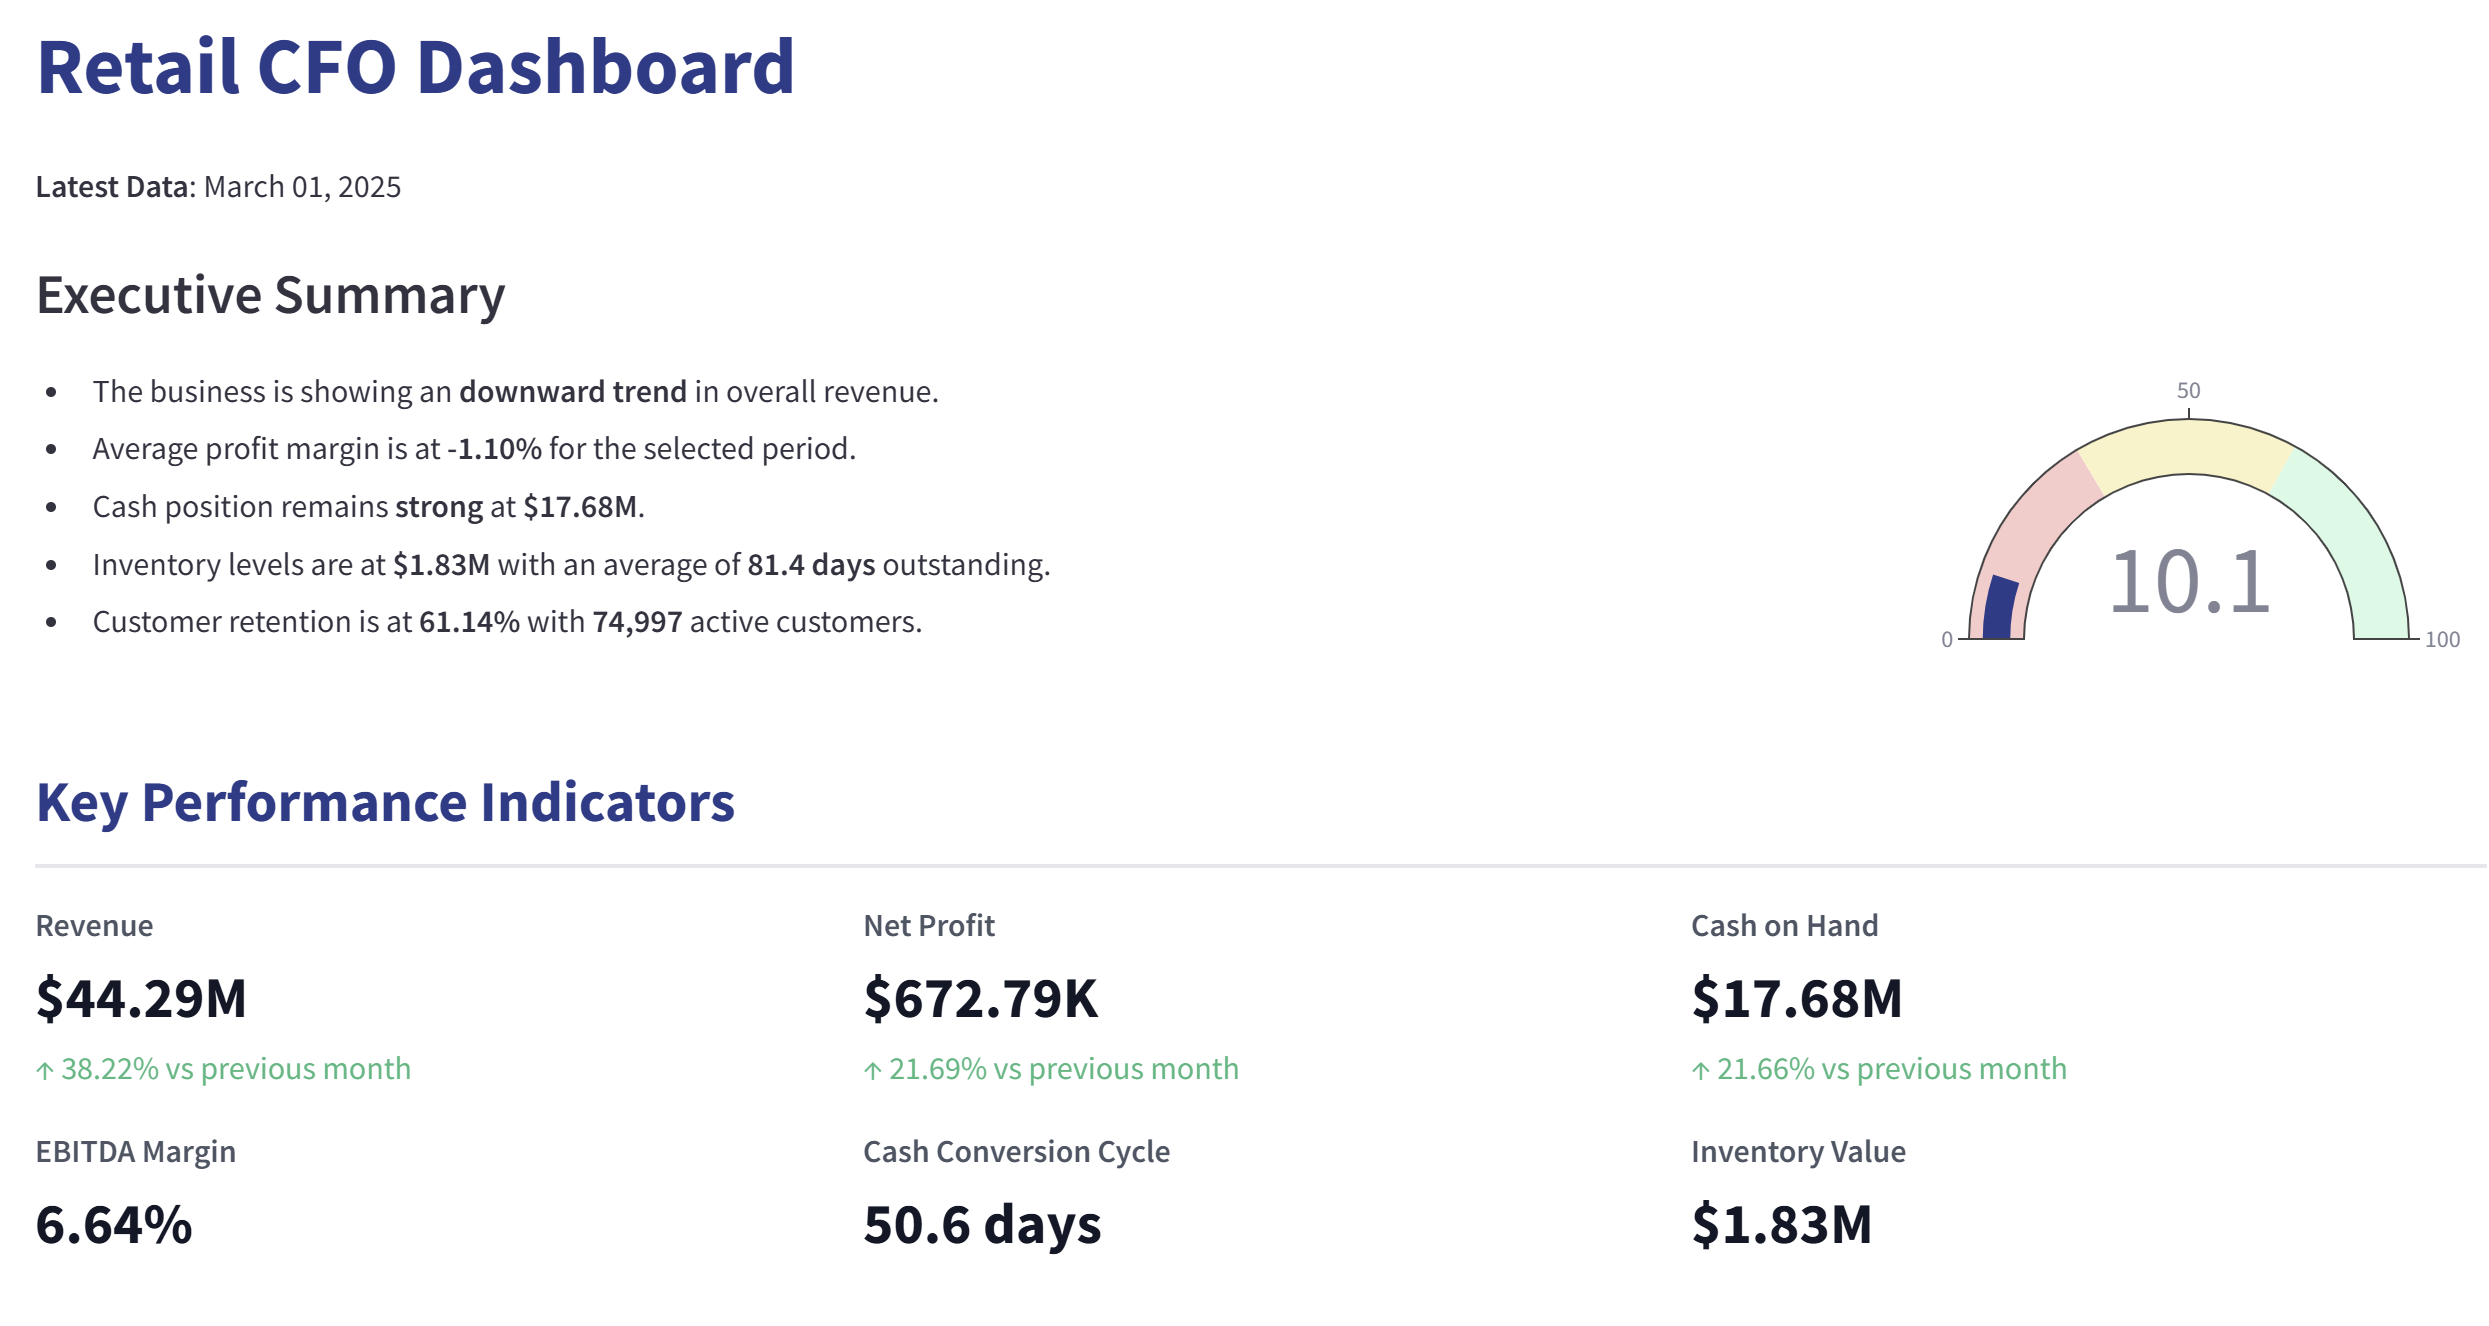
The dashboard foundation begins with core financial metrics that provide immediate visibility into organizational health. Revenue tracking incorporates multi-dimensional analysis capabilities, allowing instant drill-down from top-line figures to channel, product, and regional performance. Net profit visualization includes trend analysis and variance reporting with automated anomaly detection. EBITDA calculation follows standardized methodologies while allowing customization based on industry-specific requirements. Cash Conversion Cycle monitoring incorporates receivables aging, inventory turnover, and payables management in a synchronized view that highlights optimization opportunities.
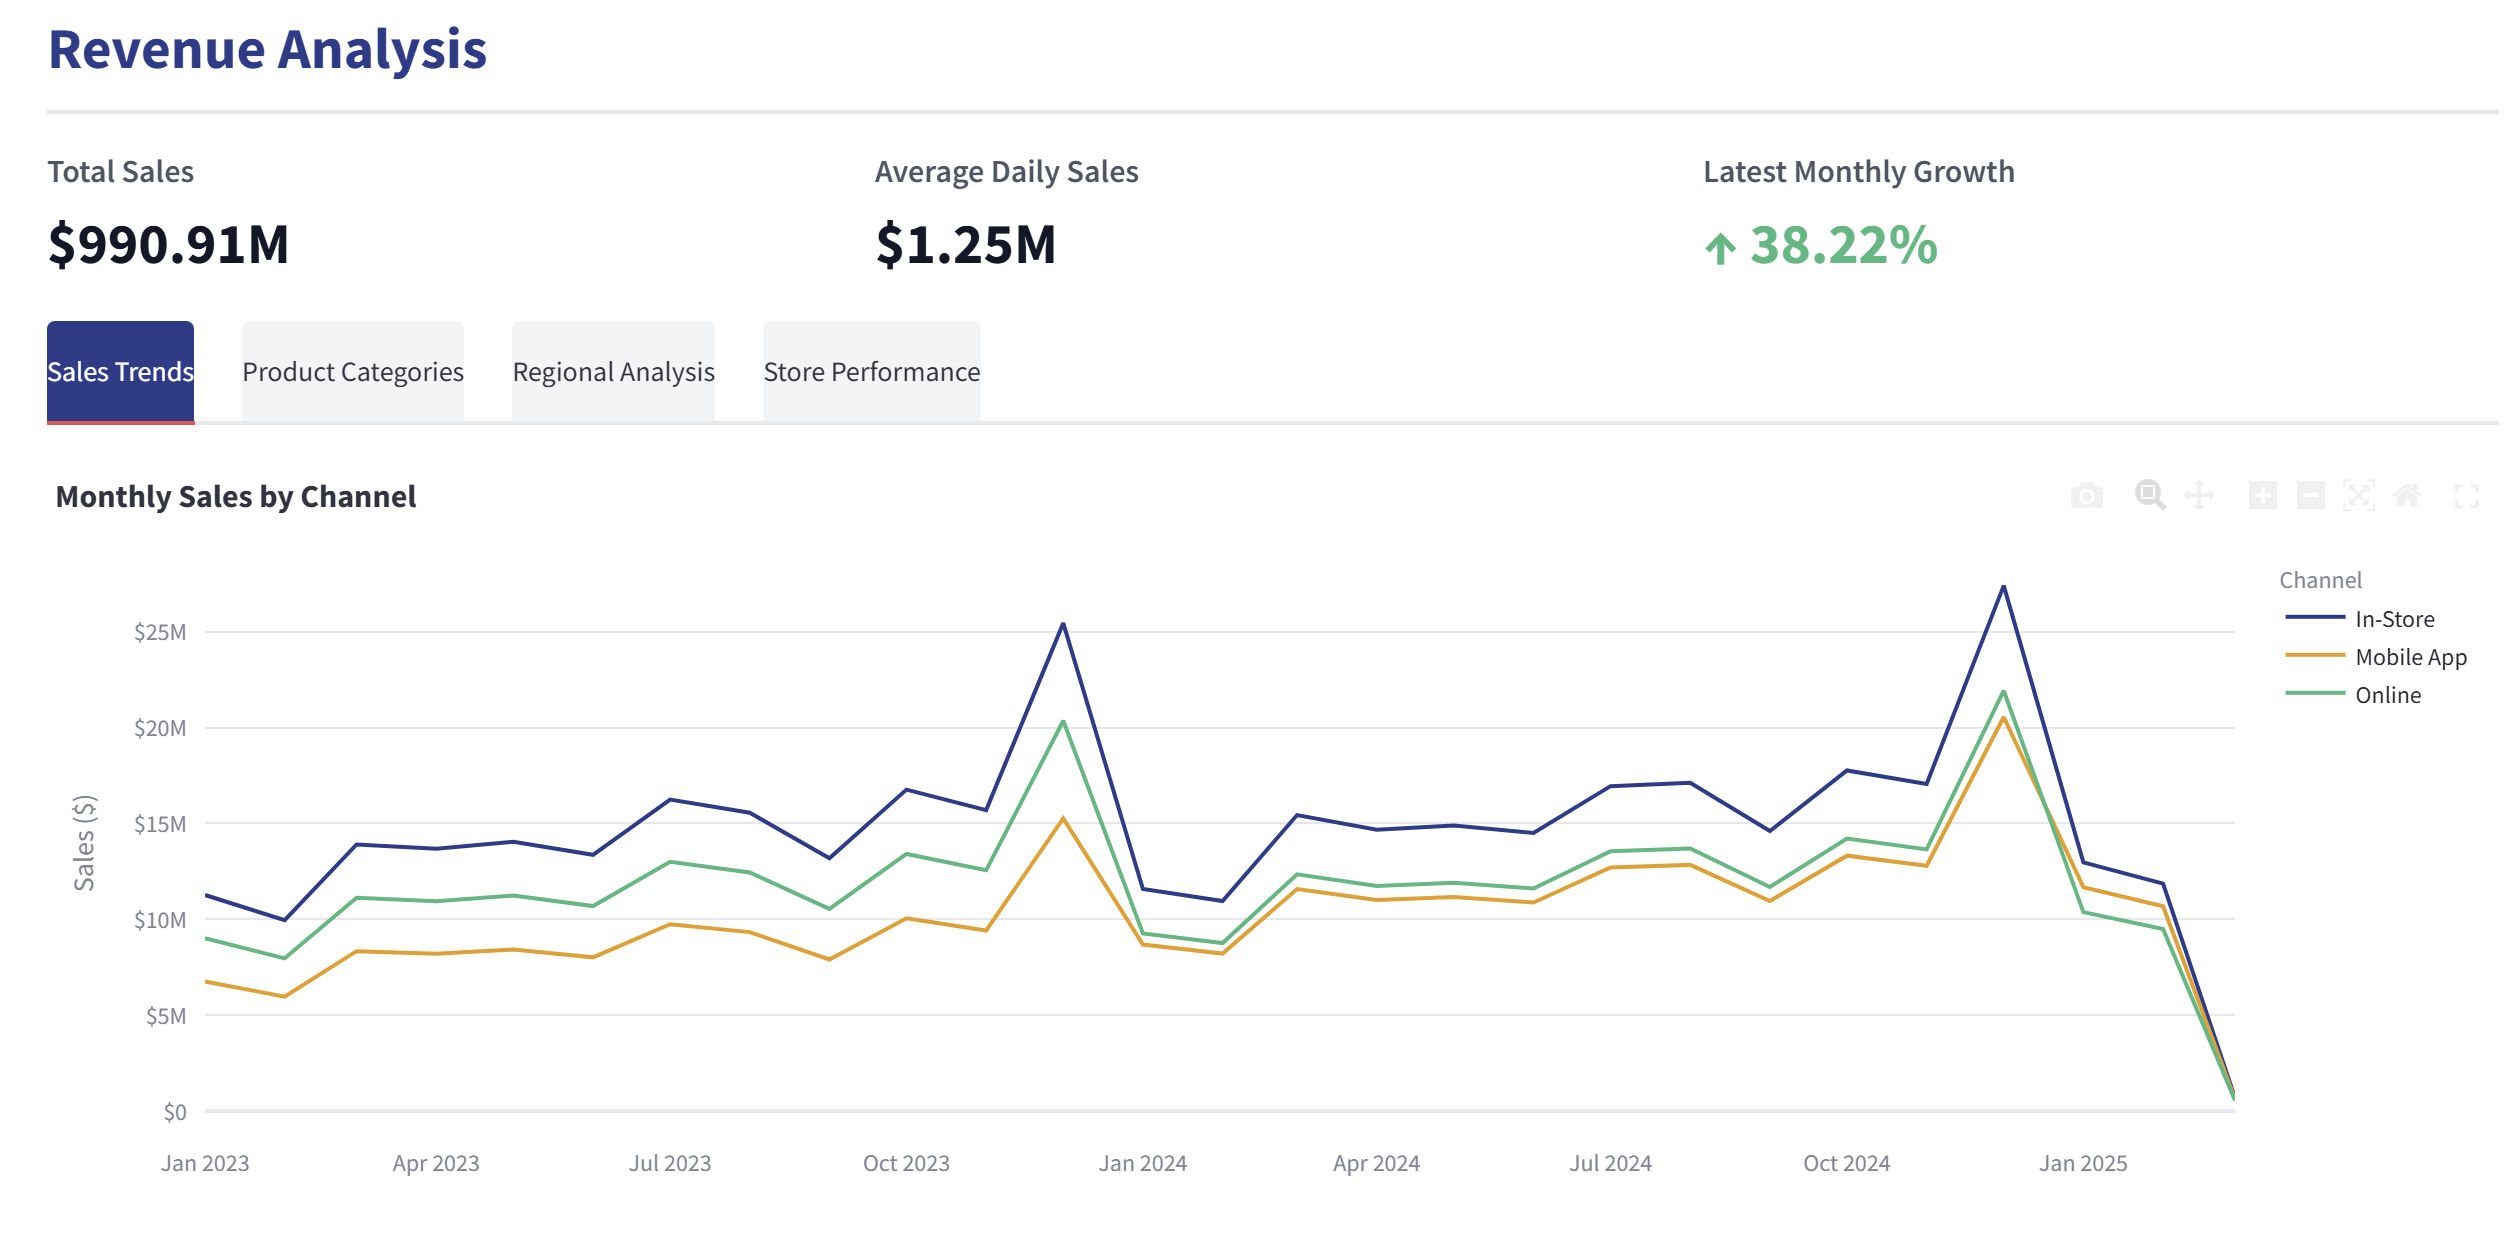
Revenue Intelligence Framework
Revenue analysis capabilities extend beyond basic reporting to deliver actionable intelligence. Sales trend visualization incorporates sophisticated time-series analysis with seasonality adjustment to identify meaningful patterns versus statistical noise. Channel attribution modeling tracks effectiveness across distribution pathways with contribution margin calculation. Product category performance incorporates lifecycle positioning and cannibalization effects. Regional analysis integrates macroeconomic indicators with localized performance metrics to contextualize results. Store performance monitoring normalizes for location-specific variables to ensure fair comparison across the operational footprint.
Profitability Enhancement Tools
The profitability section transforms traditional reporting into a strategic optimization engine. Margin analysis incorporates waterfall visualizations showing contributors to changes across reporting periods. Category profitability assessment integrates allocated overhead using activity-based costing principles. Expense analysis employs variance reporting with automated root cause identification. For manufacturing environments, COGS analysis incorporates material price variance, labor efficiency, and capacity utilization metrics. SaaS implementations feature specialized cohort analysis of customer acquisition costs against lifetime value.
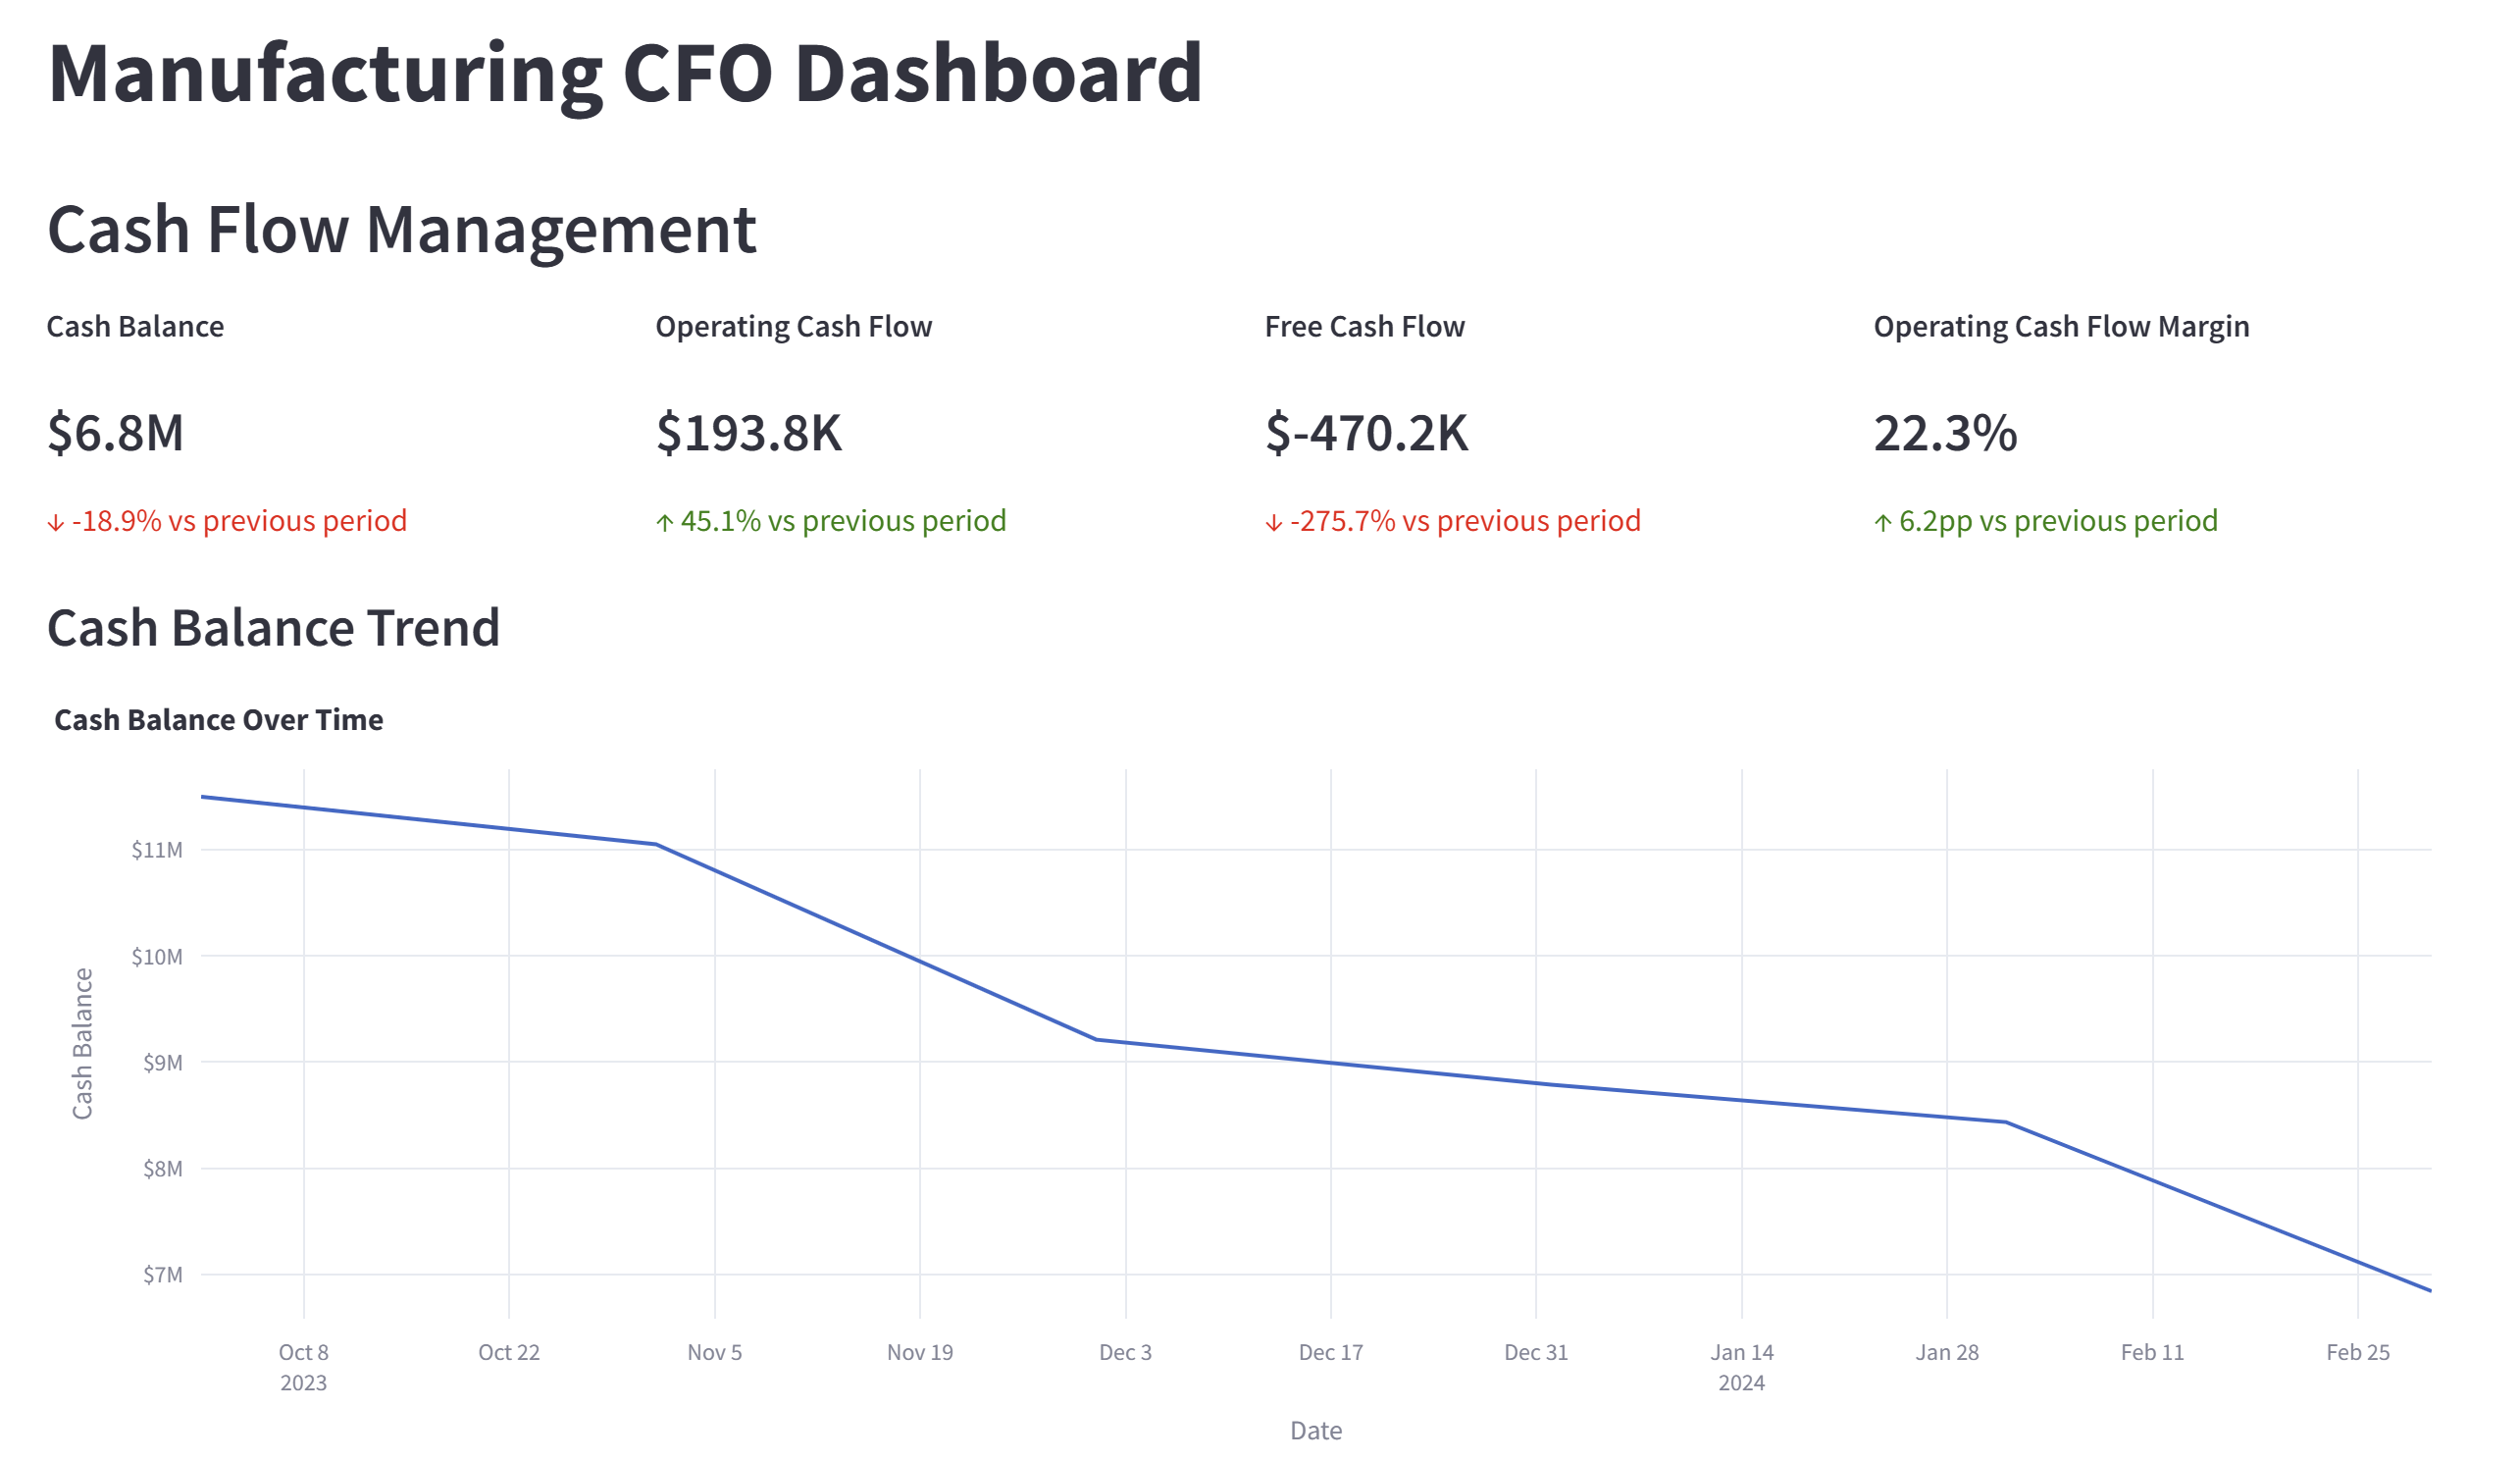
Liquidity Management Systems
Cash flow visibility receives particular attention through specialized visualization components. Cash on hand monitoring includes threshold alerts and forecasting based on historical patterns. Free cash flow calculation follows industry standard methodologies while highlighting operational versus non-operational components. Cash conversion cycle optimization tools identify specific improvement opportunities within working capital management.
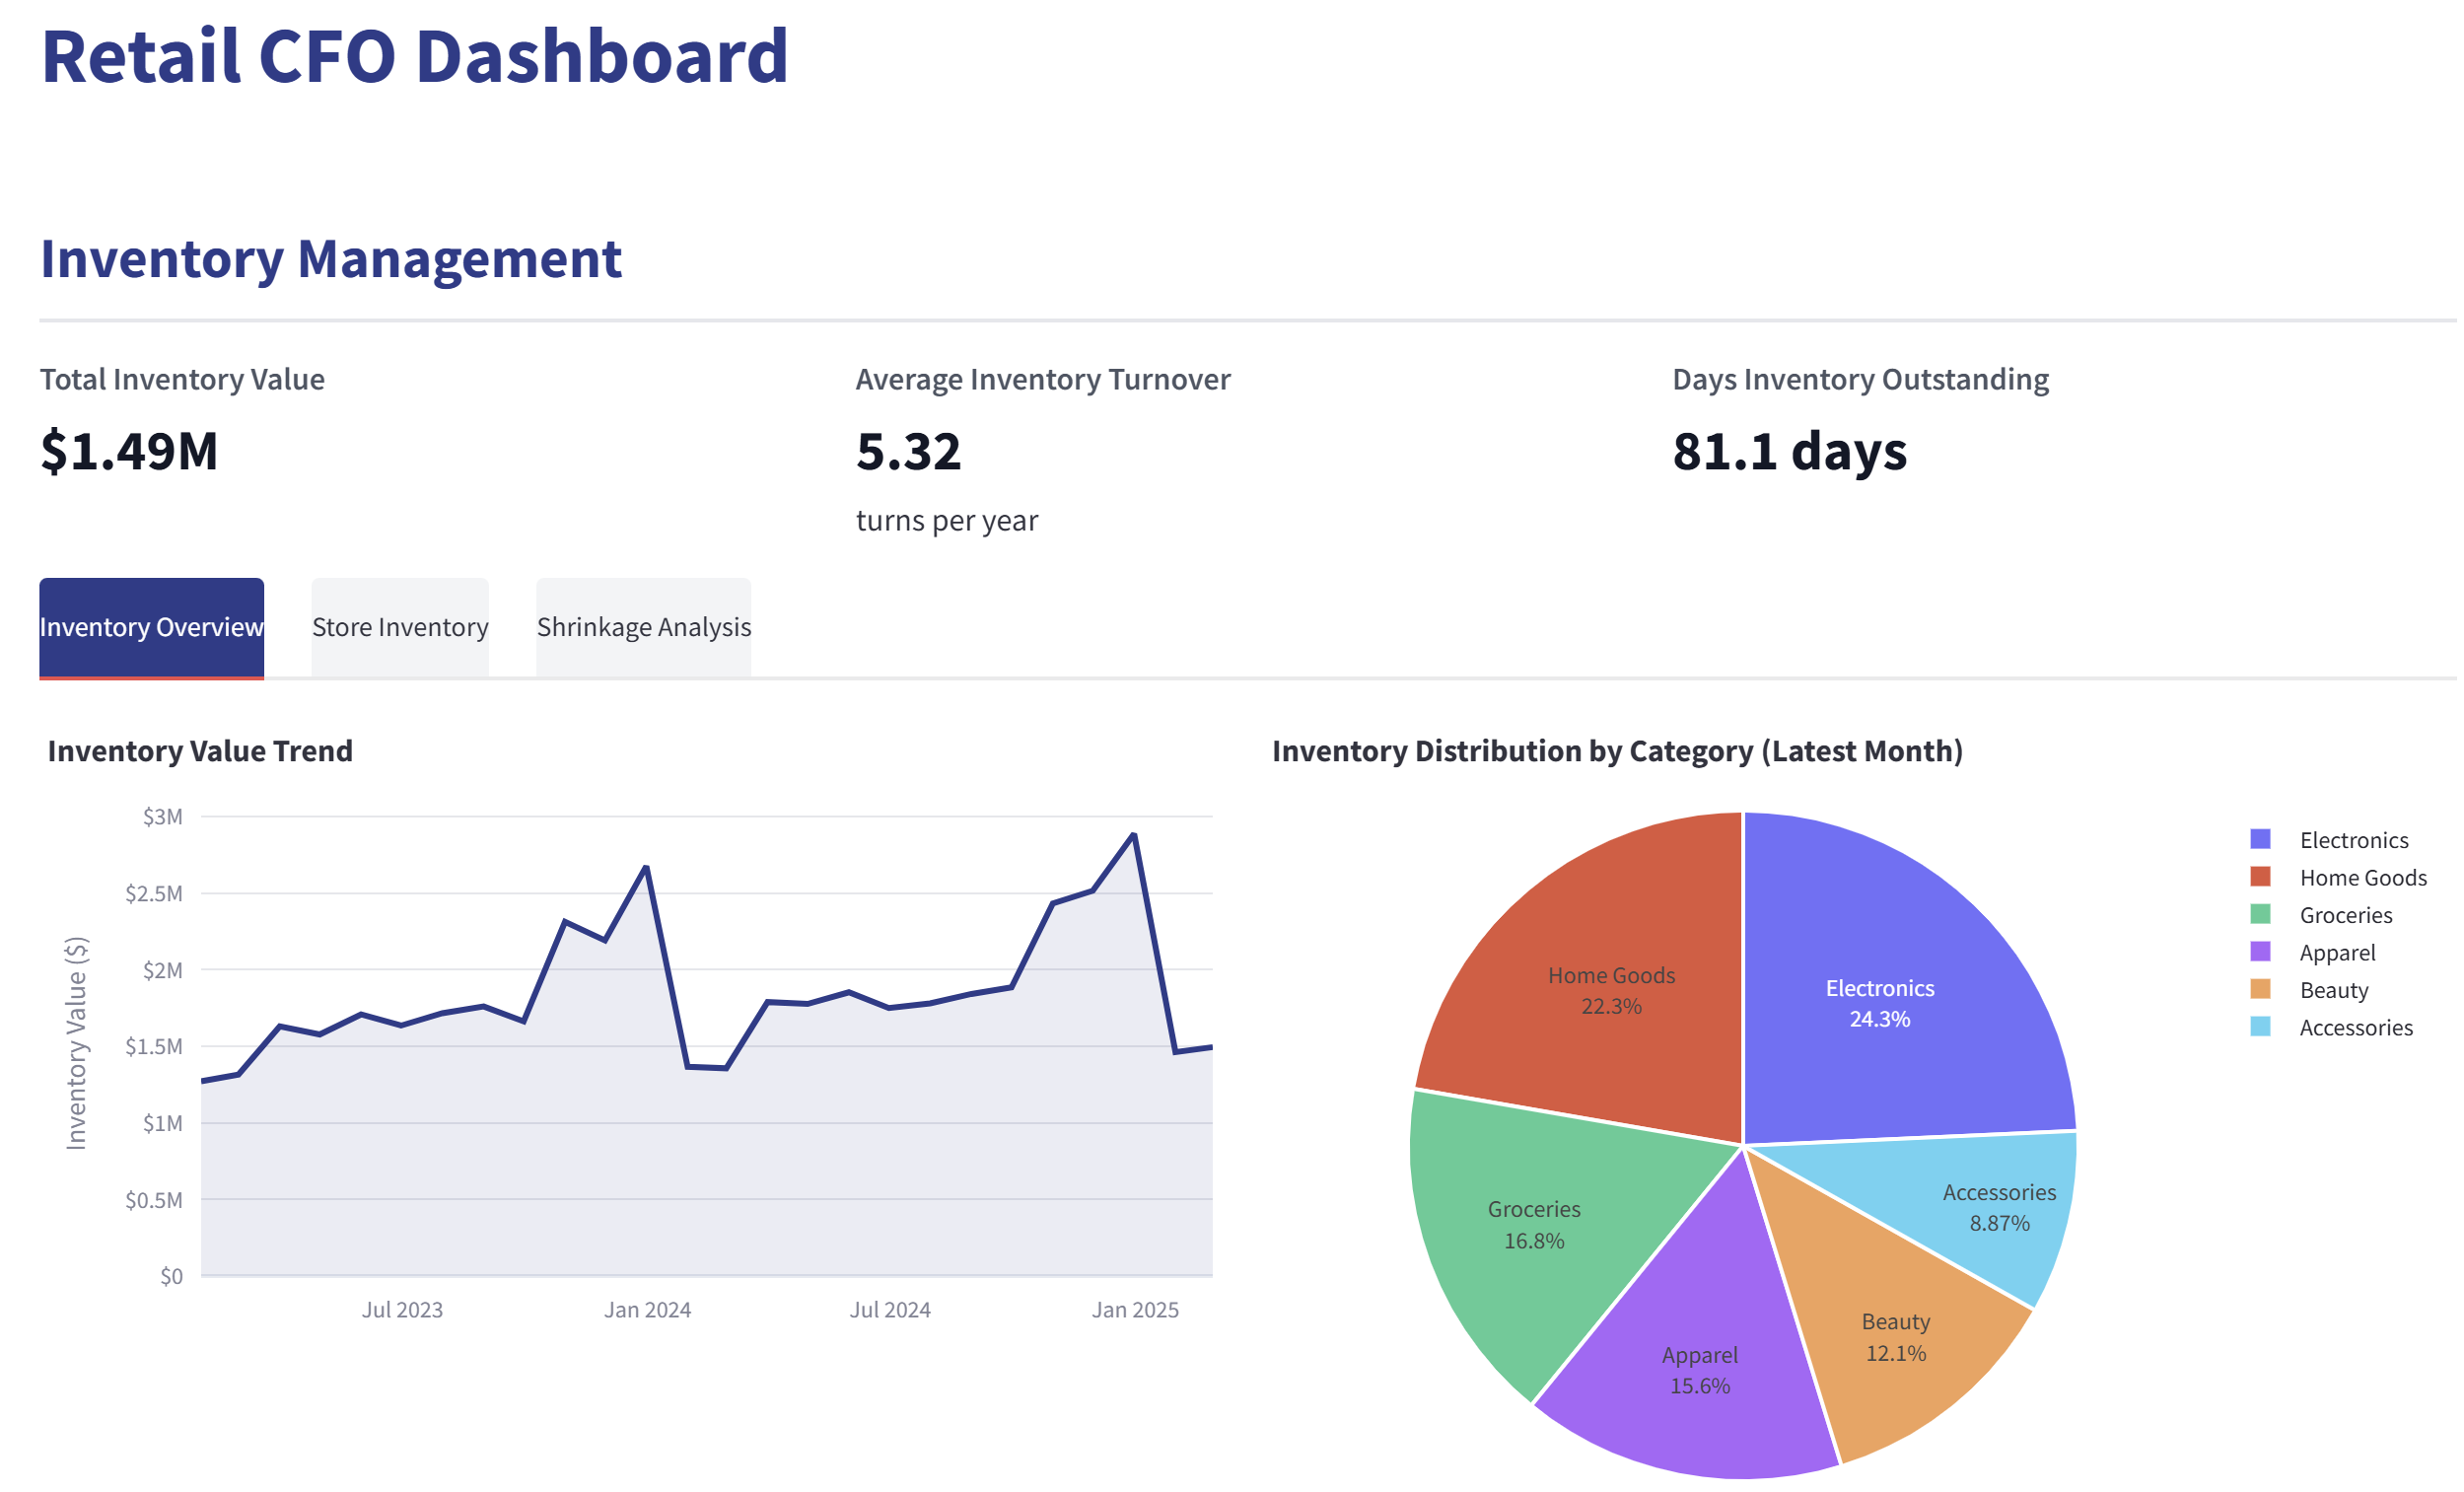
Inventory Intelligence Platform
Inventory management capabilities address this significant cash drain for product-based businesses. Distribution analysis by category reveals imbalances and optimization opportunities. Stock-out percentage tracking by location identifies fulfillment risks. Turnover rates are calculated with seasonally-adjusted expectations. Carrying cost analysis integrates with financial reporting to demonstrate P&L impact.
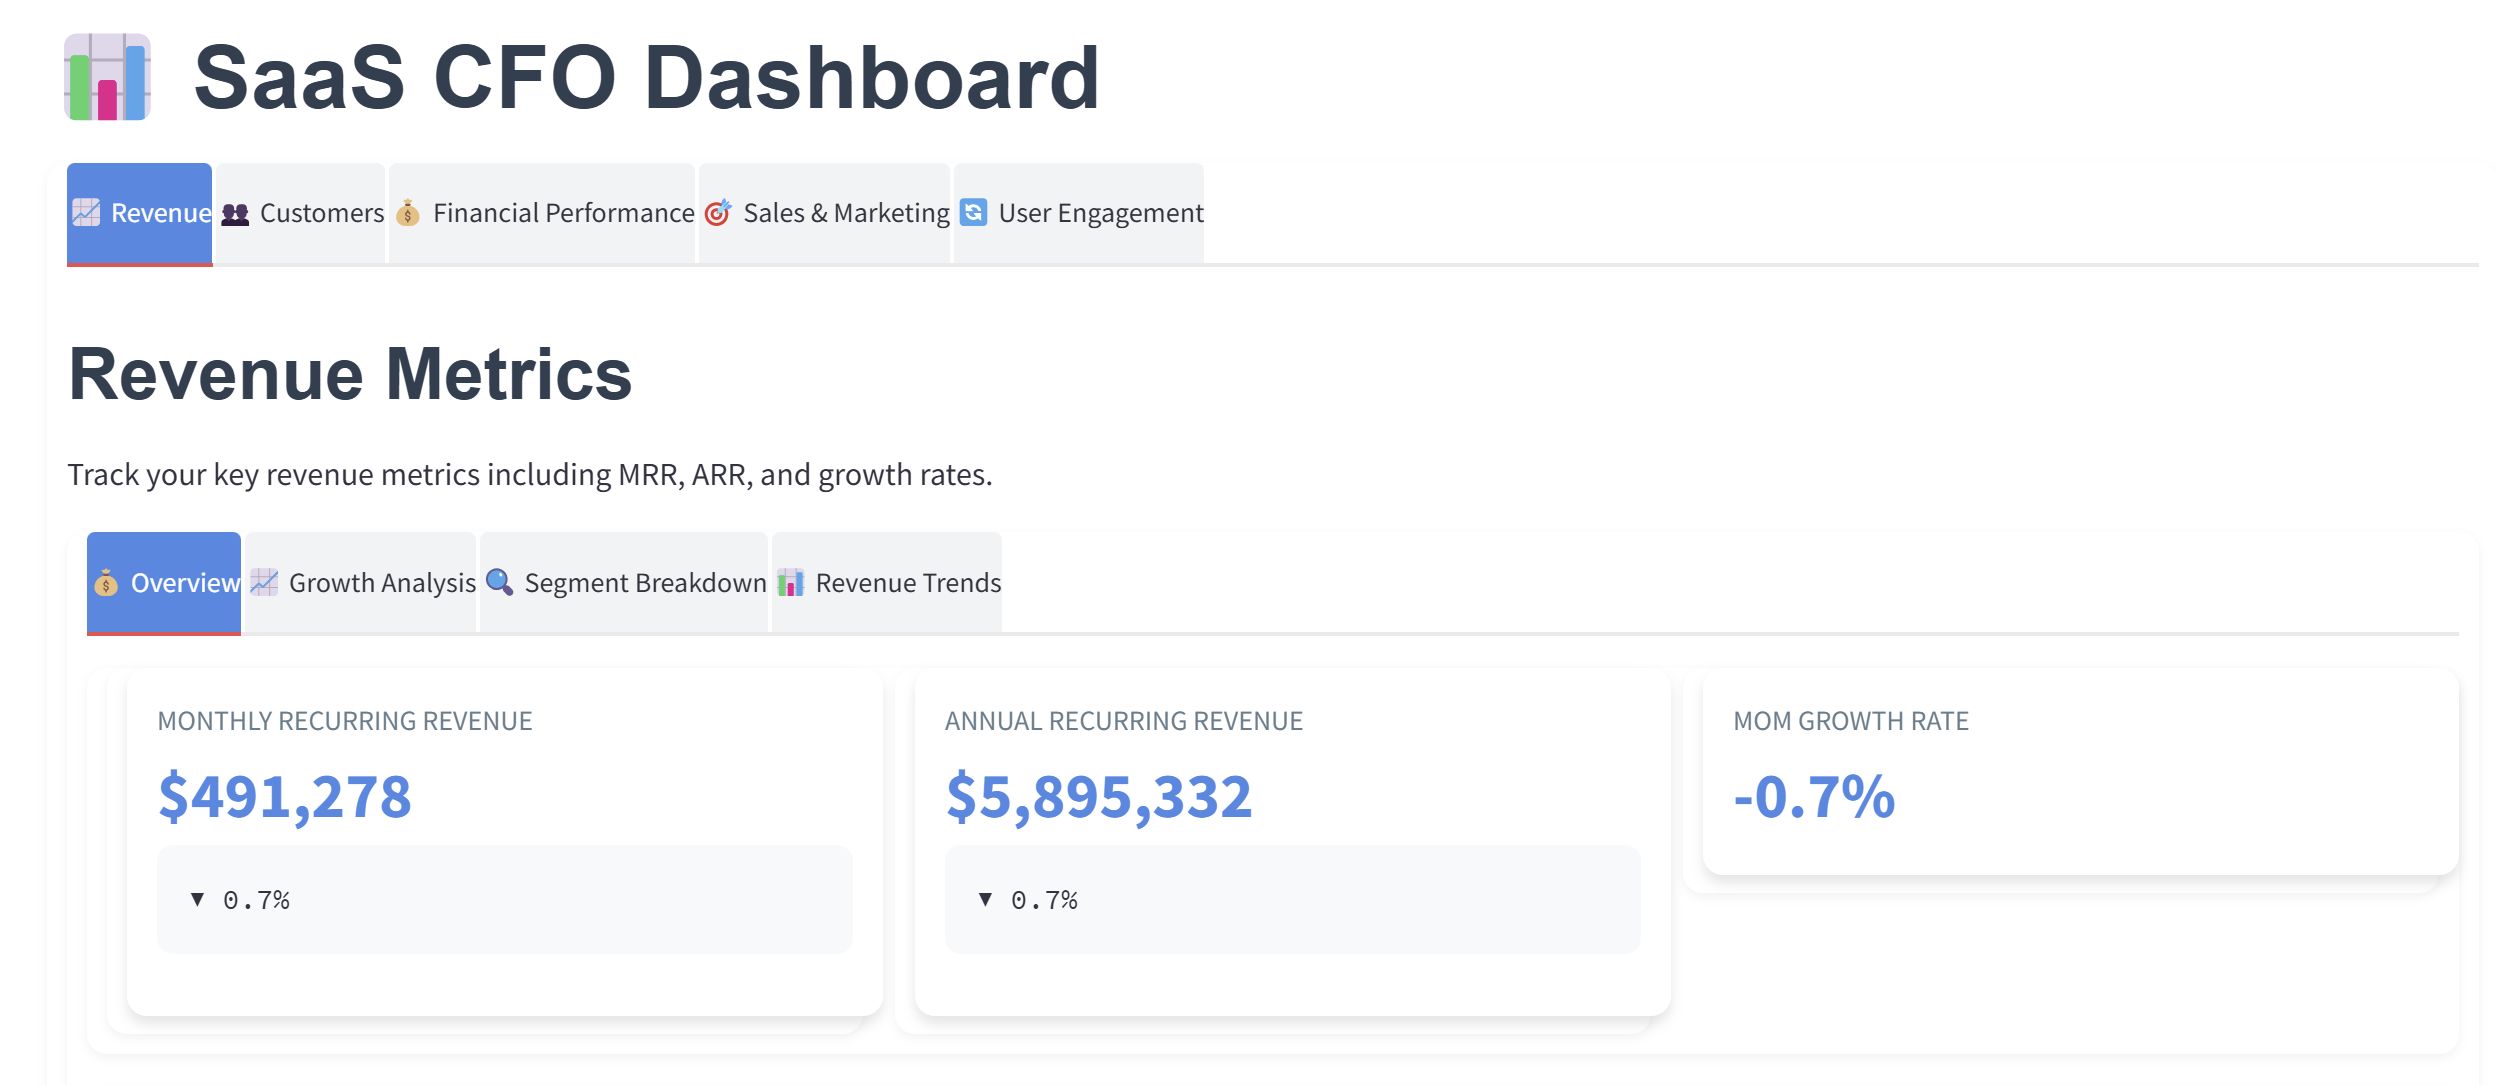
Customer Economic Monitoring
Customer metrics round out the dashboard with forward-looking indicators. Active customer tracking includes segmentation by value tier and growth potential. Average transaction monitoring identifies opportunity for upsell and cross-sell initiatives. Retention rate visualization highlights cohort performance with early warning indicators for at-risk segments. For SaaS businesses, specialized MRR and ARR tracking includes expansion, contraction, and churn components with forecast modeling.
Transformational Benefits of Integrated Financial Visibility
Organizations implementing unified financial dashboards report substantial and measurable improvements across multiple dimensions. Decision quality improves substantially when leadership operates from a single, trusted data source. Cross-functional alignment increases as departmental leaders gain visibility into how their operational decisions impact financial outcomes. CFOs report significantly enhanced ability to respond to board and investor inquiries with precise, contextual information rather than generalized approximations.
The long-term advantages compound over time. Organizations with integrated financial visibility demonstrate greater forecast accuracy, more effective capital allocation, and faster response to market shifts. Perhaps most importantly, these companies build a data-driven decision culture where financial insights drive strategic choices rather than merely recording their outcomes.
Implementing Your Custom Financial Dashboard
Experiencing these benefits begins with a simple next step: visiting a demonstration of our dashboard customized to your industry context. Whether you operate in retail, manufacturing, or SaaS environments, we’ve developed specialized visualizations that address your specific challenges and metrics.
The implementation process follows a proven methodology that minimizes disruption while maximizing value delivery. Our team begins by understanding your current systems landscape and reporting requirements, then configures the appropriate integration points to automate data flow. The result is a completely customized solution tailored to your organizational needs, typically implemented within 4-6 weeks.
After implementation, our ongoing support ensures your dashboard evolves as your business needs change. Remember, in the world of financial visibility, those who dashboard together, last together.
Transform Your Financial Decision Making Today
Contact us today to schedule your personalized demo using your actual business data. Discover how quickly you can move from fragmented financial visibility to integrated, actionable insights. Don’t let another quarter pass with outdated reporting processes-your competitors certainly aren’t waiting.
By submitting this form, you agree that Finaprins may contact you occasionally via email to make you aware of Finaprins products and services. You may withdraw your consent at any time. For more details see the Finaprins Privacy Policy.
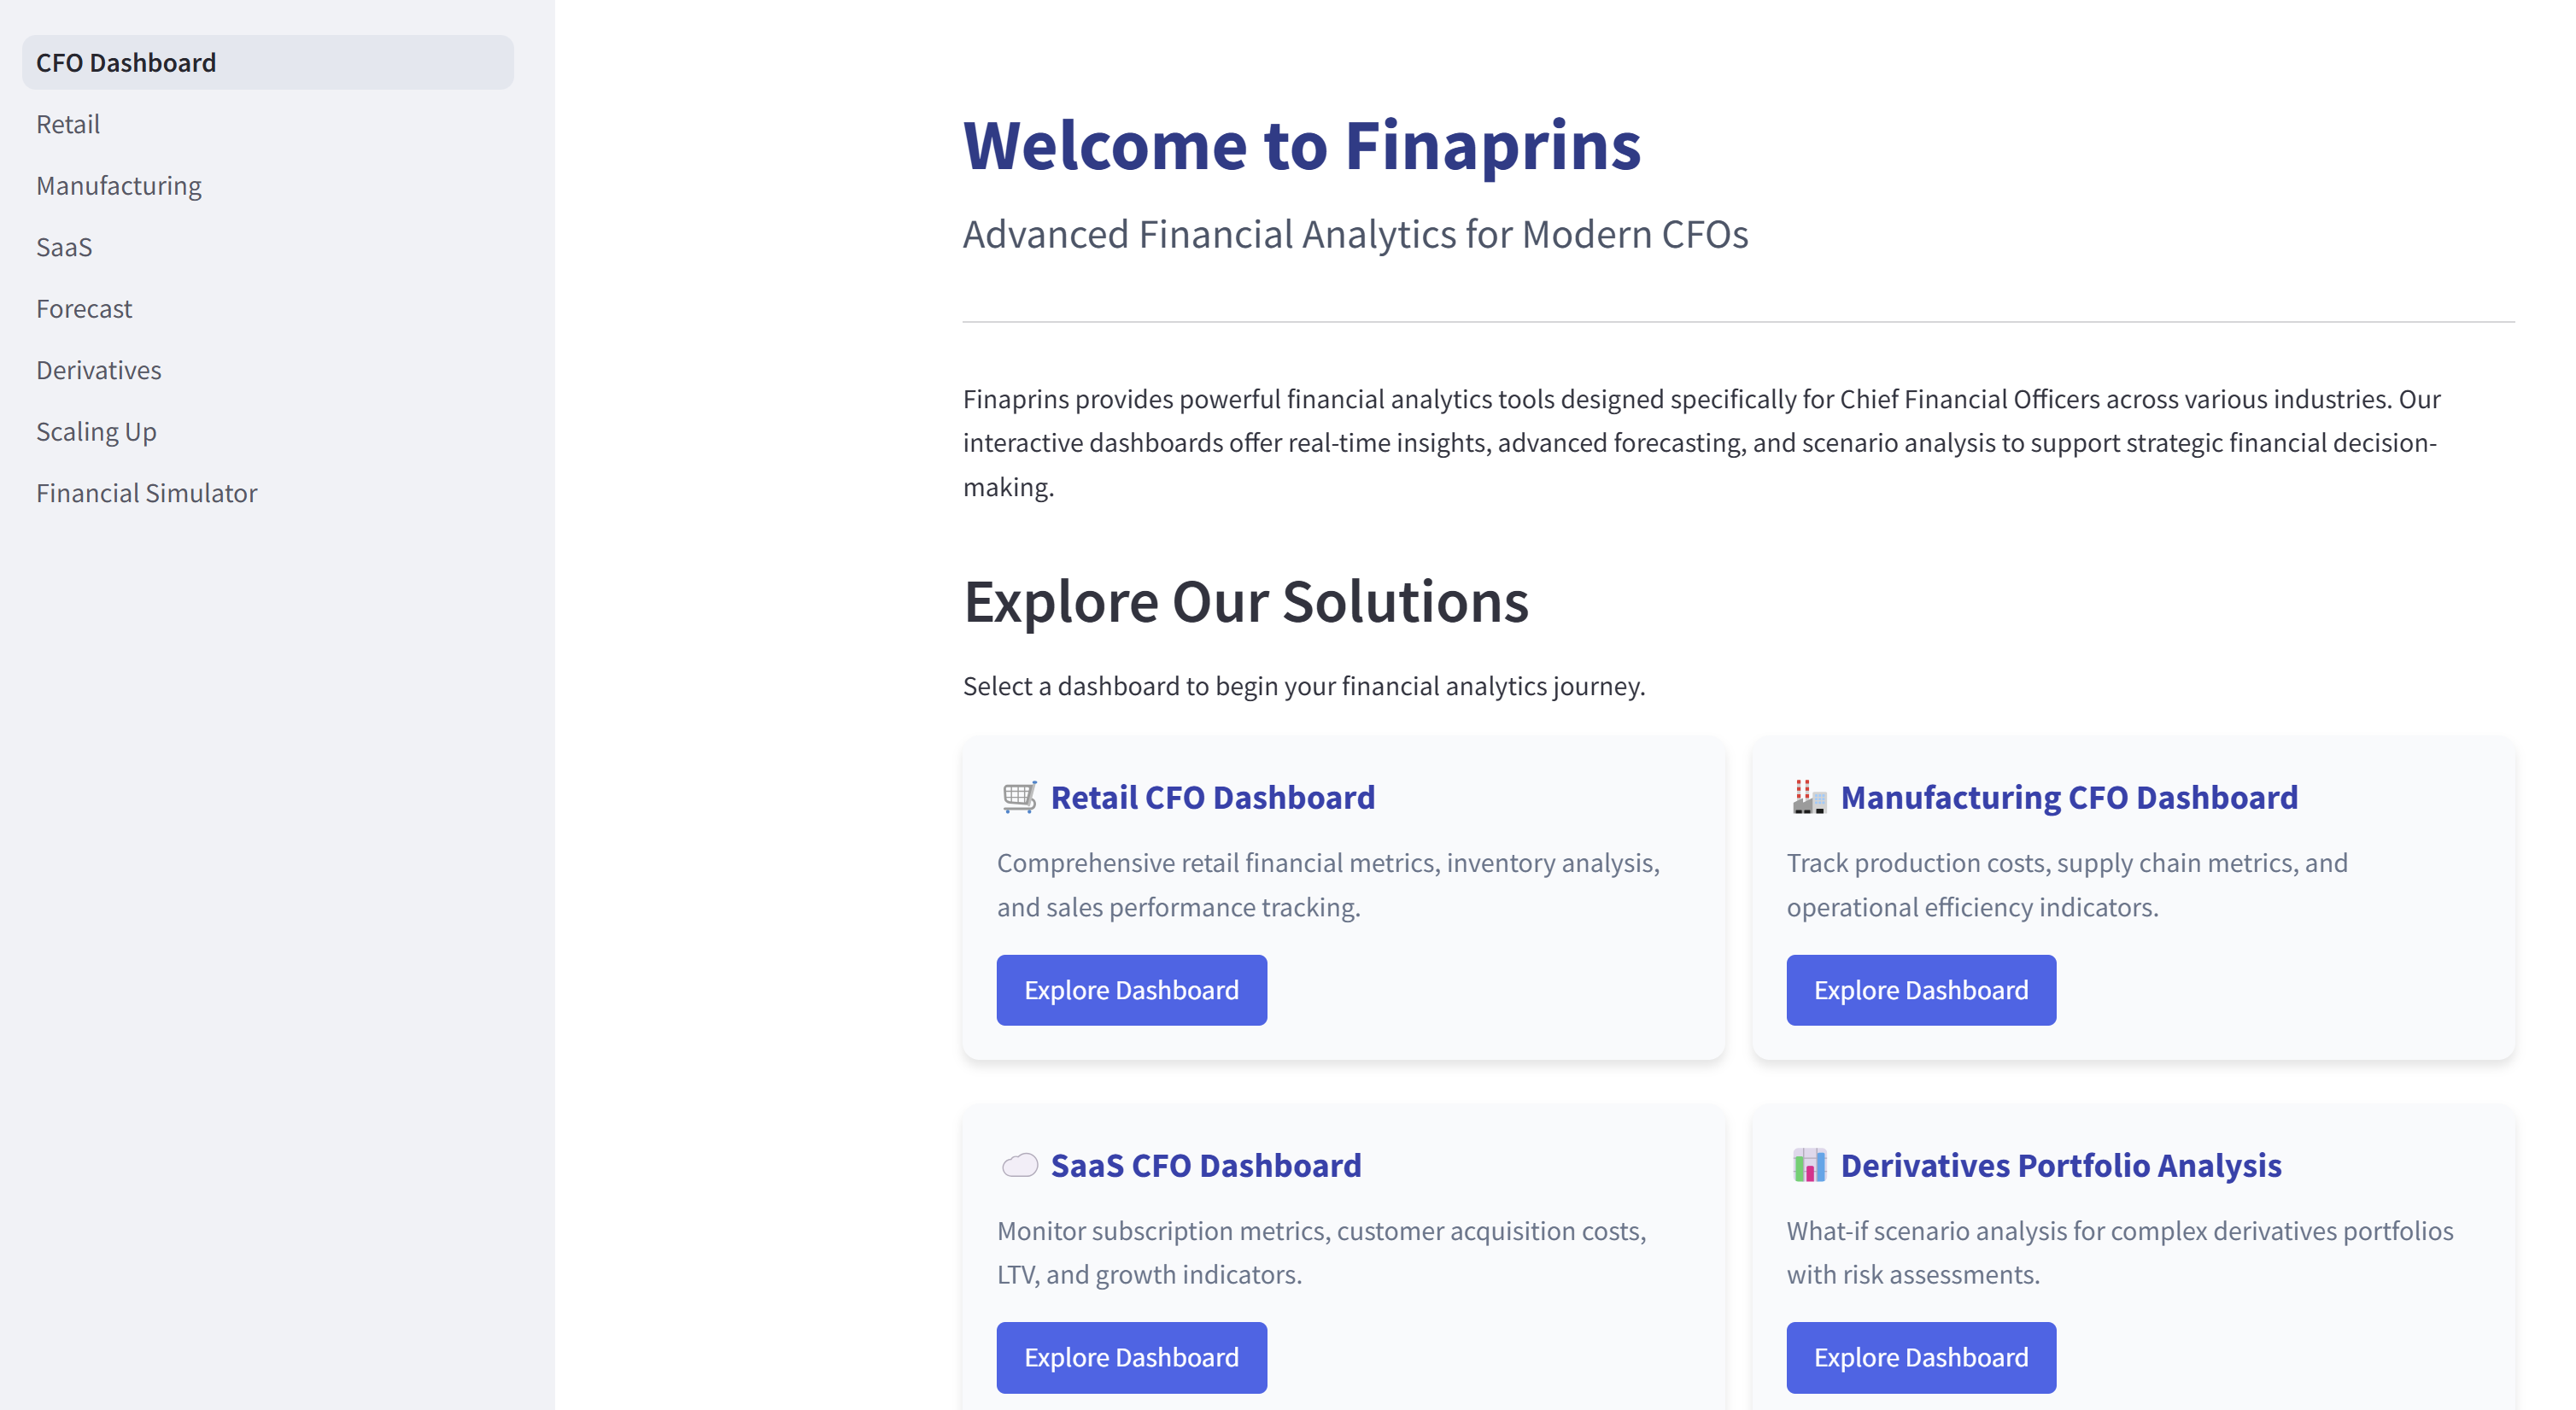
Photo by David Rodrigo on Unsplash