Unlock Investment Potential: Introducing a Unified Analytics Solution
Financial departments grapple with fragmented investment data, hindering timely, compliant decision-making. Siloed systems and manual processes obscure true performance drivers and delay opportunity identification. This article introduces a demo of a managed unified investment analytics platform for asset managers, designed to overcome these critical operational hurdles and provide clarity.
The Daily Grind: Challenges in Investment Performance Attribution Analysis
Investment teams constantly battle inefficiencies stemming from disconnected data landscapes. Portfolio managers struggle to rebalance effectively without real-time attribution, while analysts lose valuable days manually compiling data for screening, potentially missing market shifts. This environment breeds performance attribution calculation errors, making it difficult to understand the genuine sources of returns, especially when dealing with complex portfolios involving multi-asset class attribution issues.
Operations teams face the recurring nightmare of reducing manual NAV reconciliation errors, a task consuming significant time and risking client trust. Similarly, compliance officers often scramble to meet reporting deadlines, hampered by manual data extraction. The lack of an automated fund reconciliation process means risk officers might miss concentrated factor exposures hidden within diversified holdings. It often feels like trying to assemble a jigsaw puzzle in the dark, blindfolded, using pieces from different boxes.
Streamlining Insights: A Managed Analytics and ETL Solution
Our solution directly addresses these pain points through a managed service approach, combining a powerful investment fund dashboard with a robust managed ETL process for alternative investment data integration. This means clients gain sophisticated capabilities without the burden of managing underlying technology or infrastructure, crucial when integrating alt data portfolio streams. The platform employs sophisticated data modeling for investment performance to ensure accuracy and consistency.
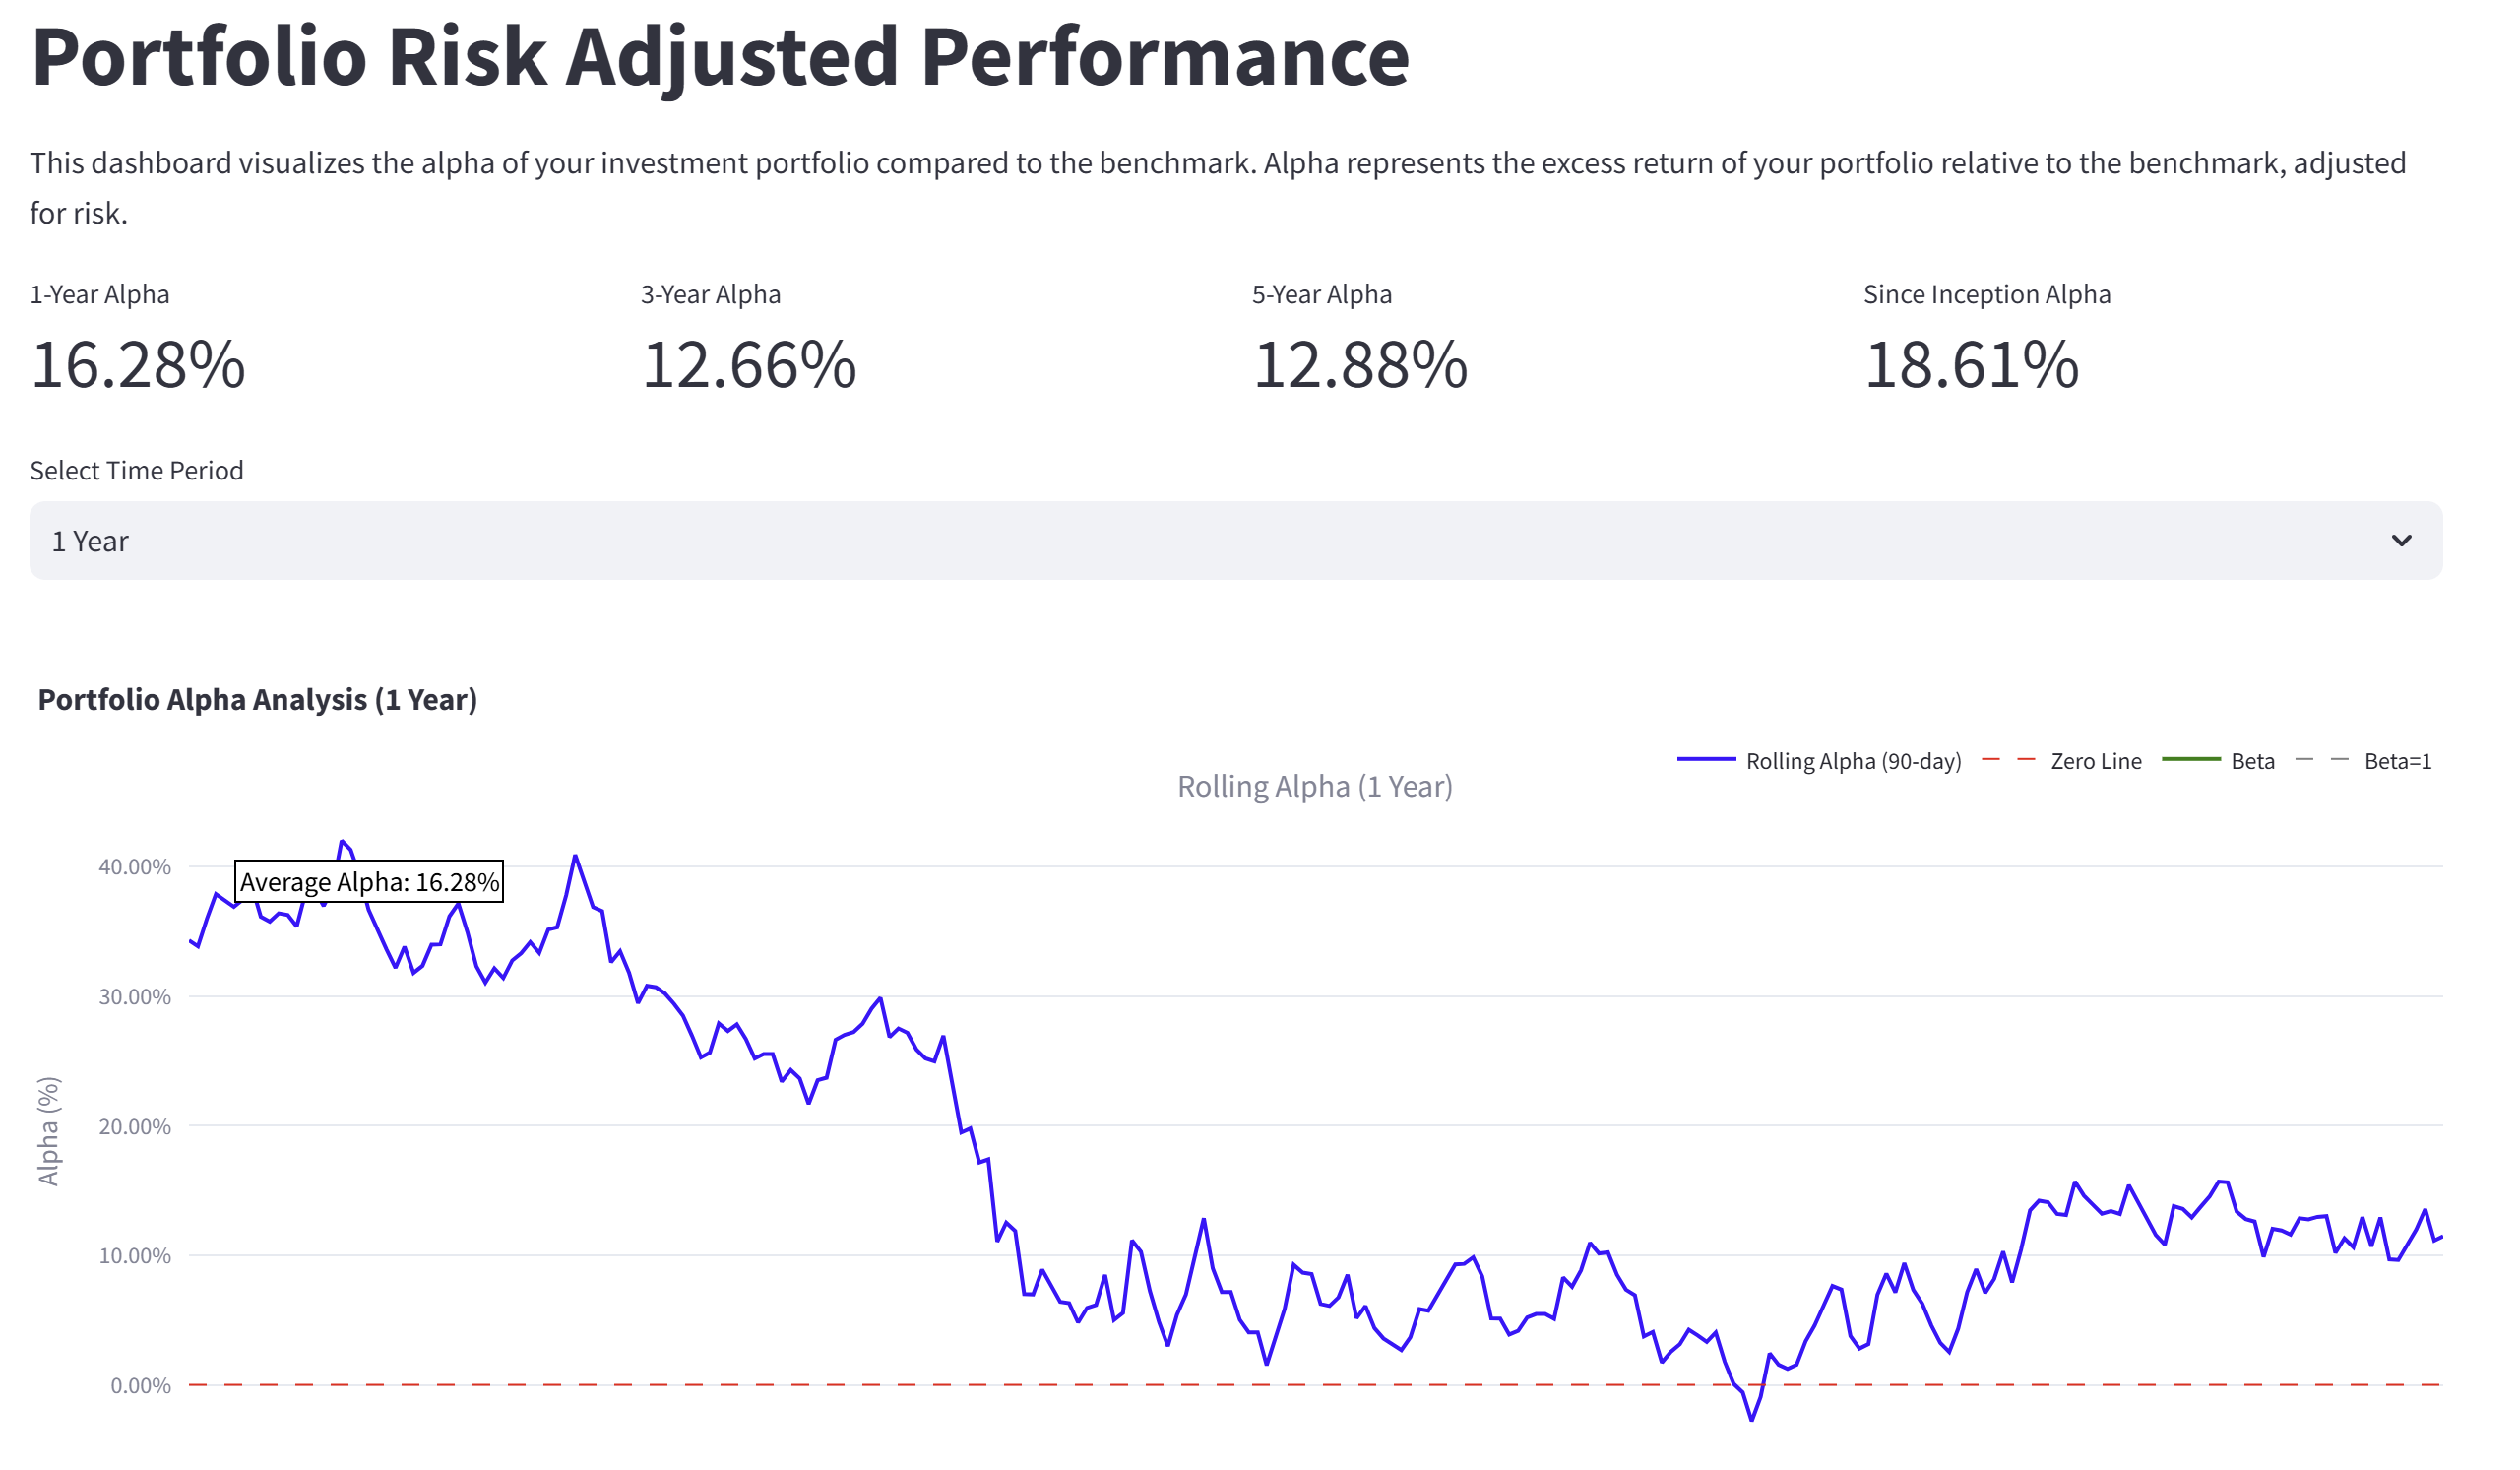
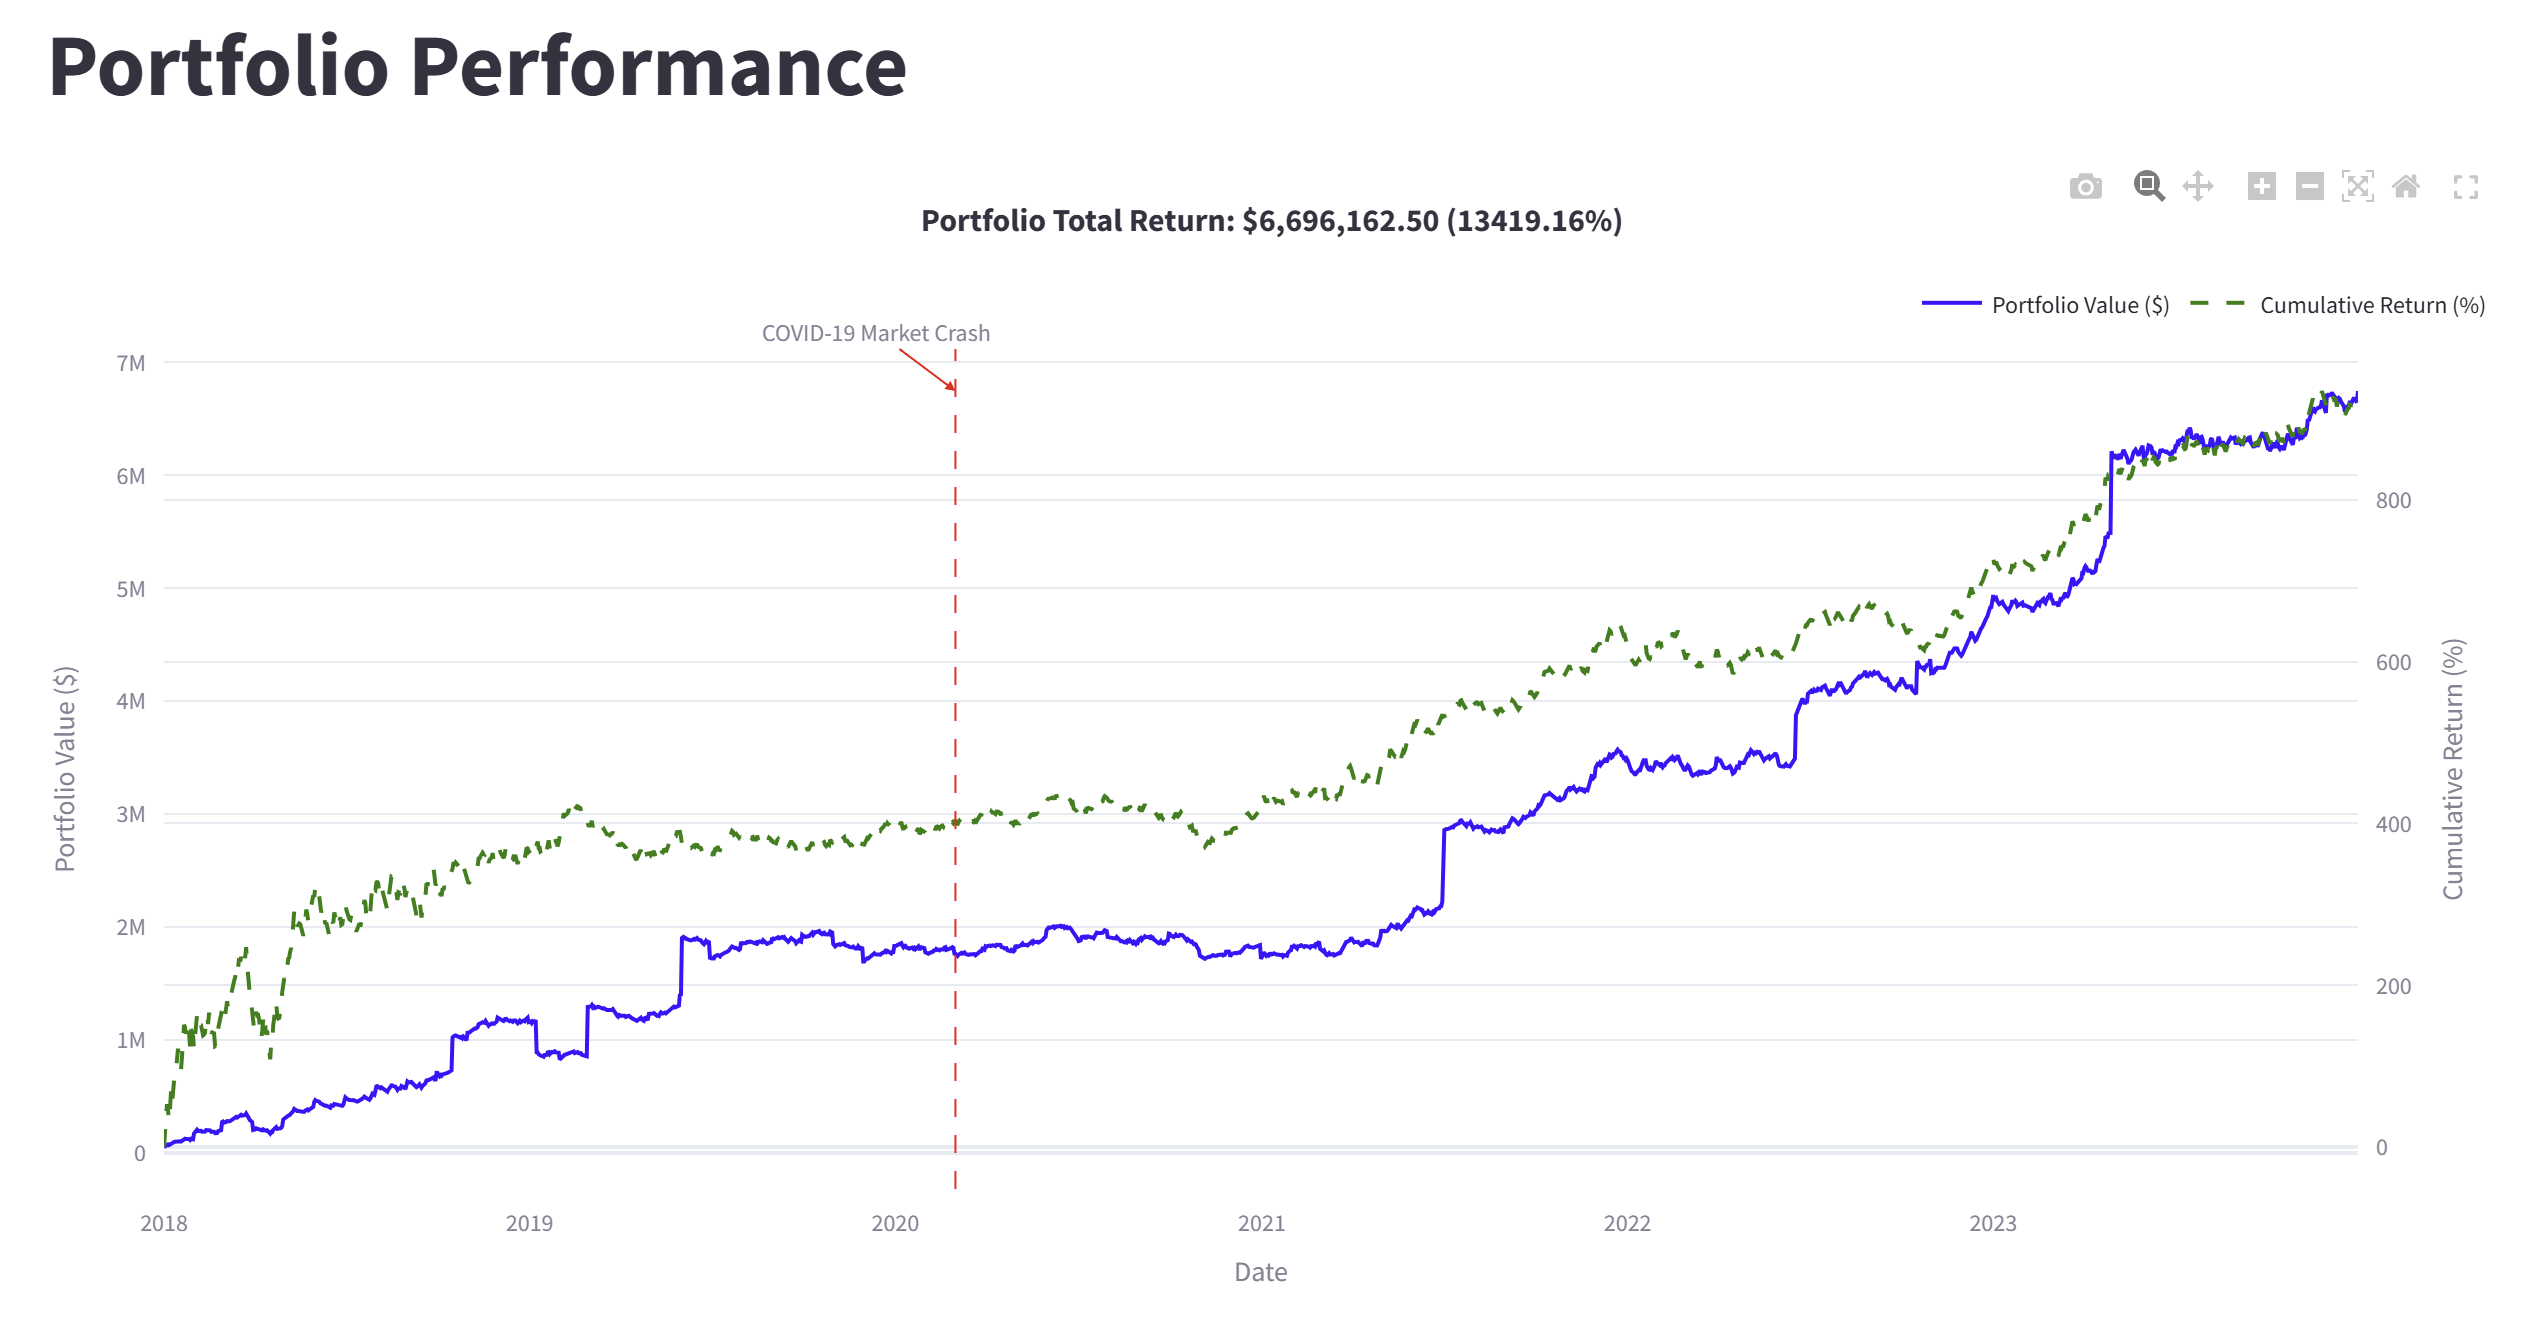
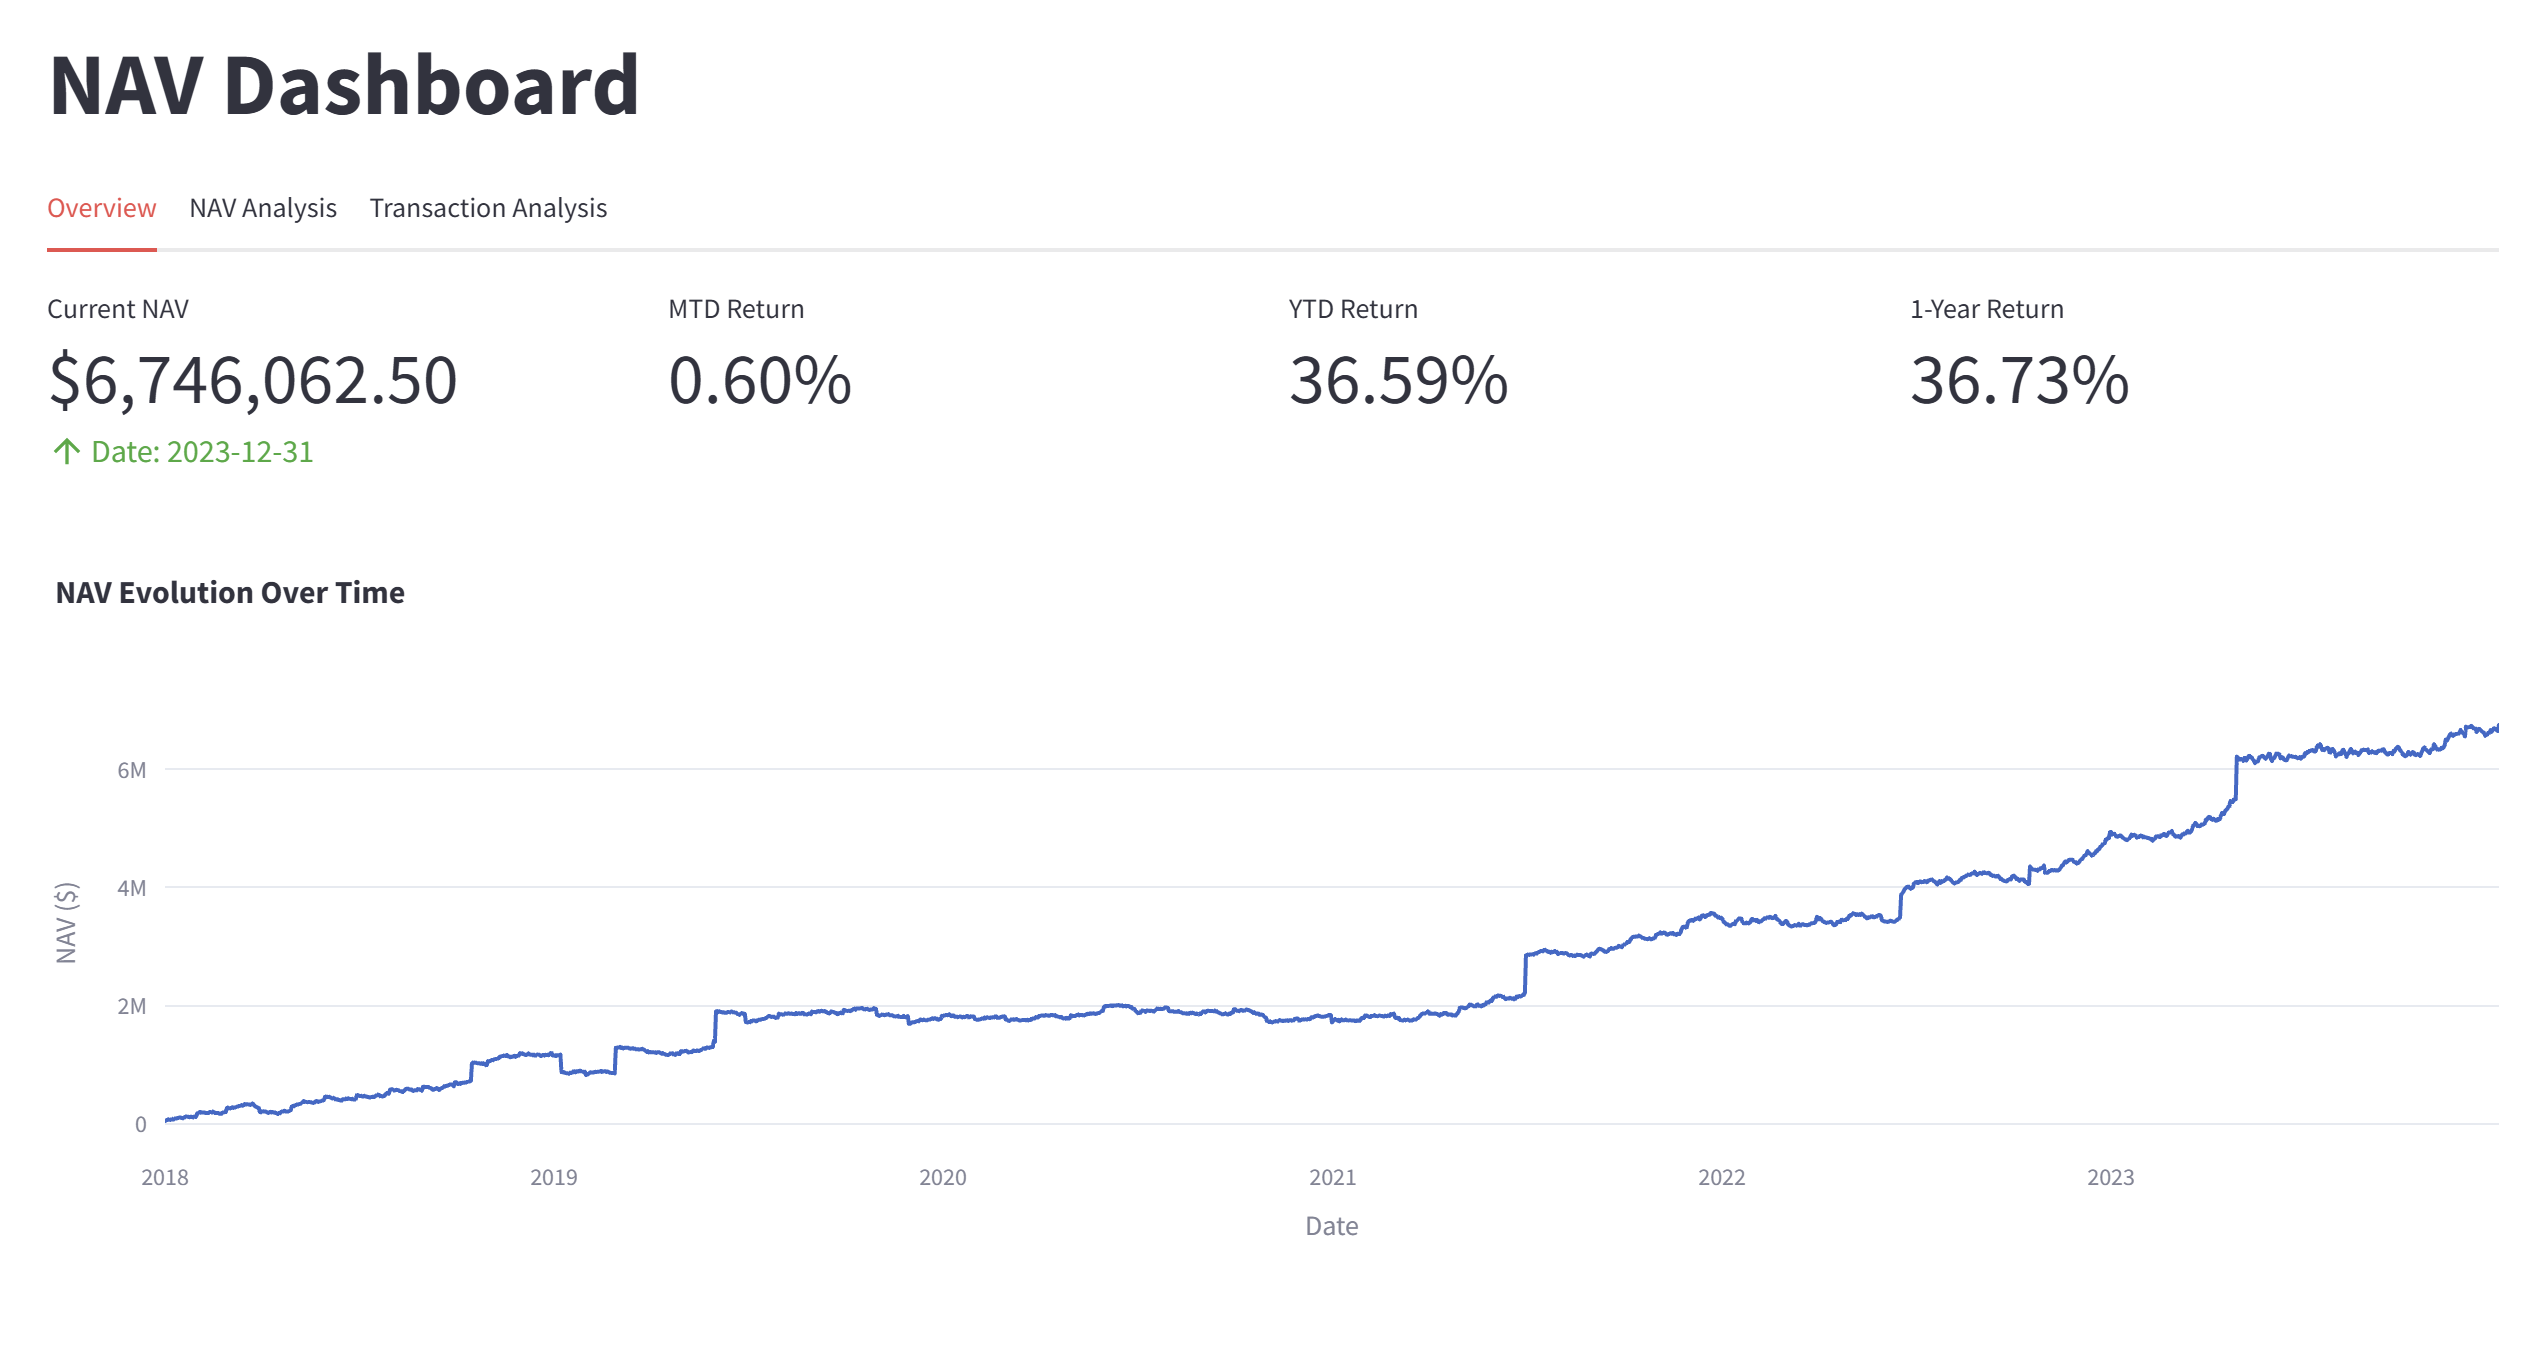
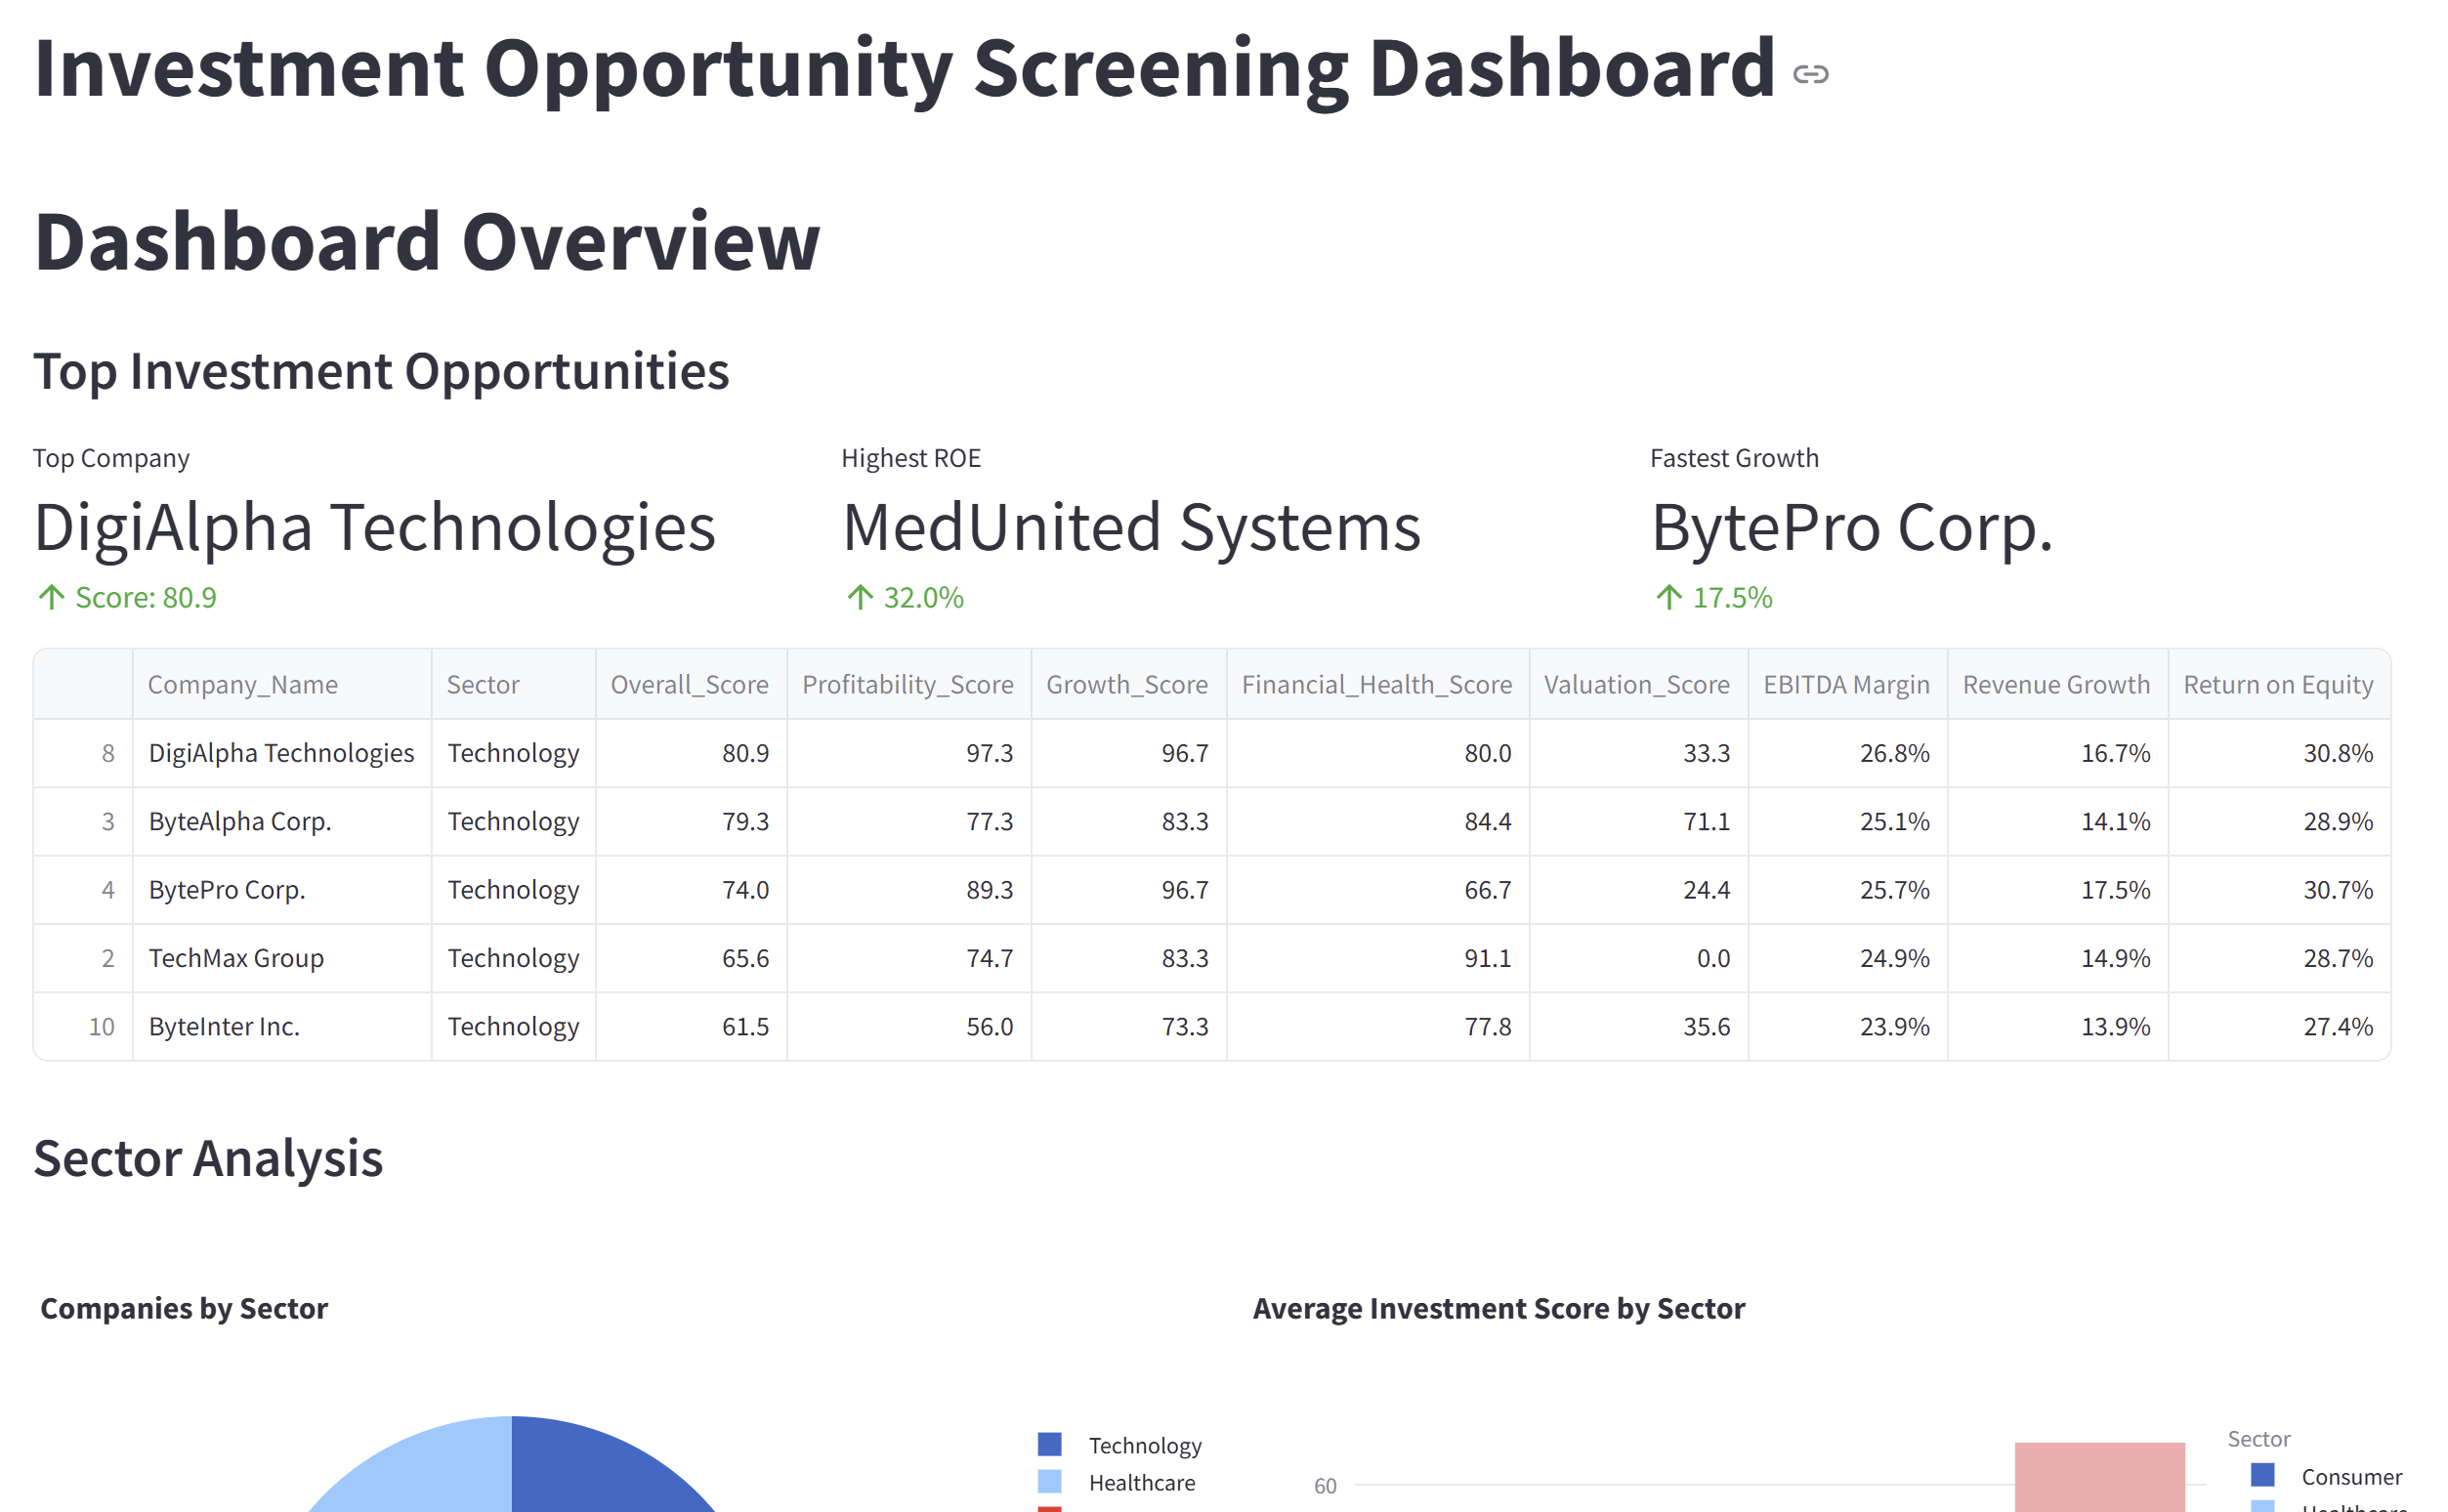
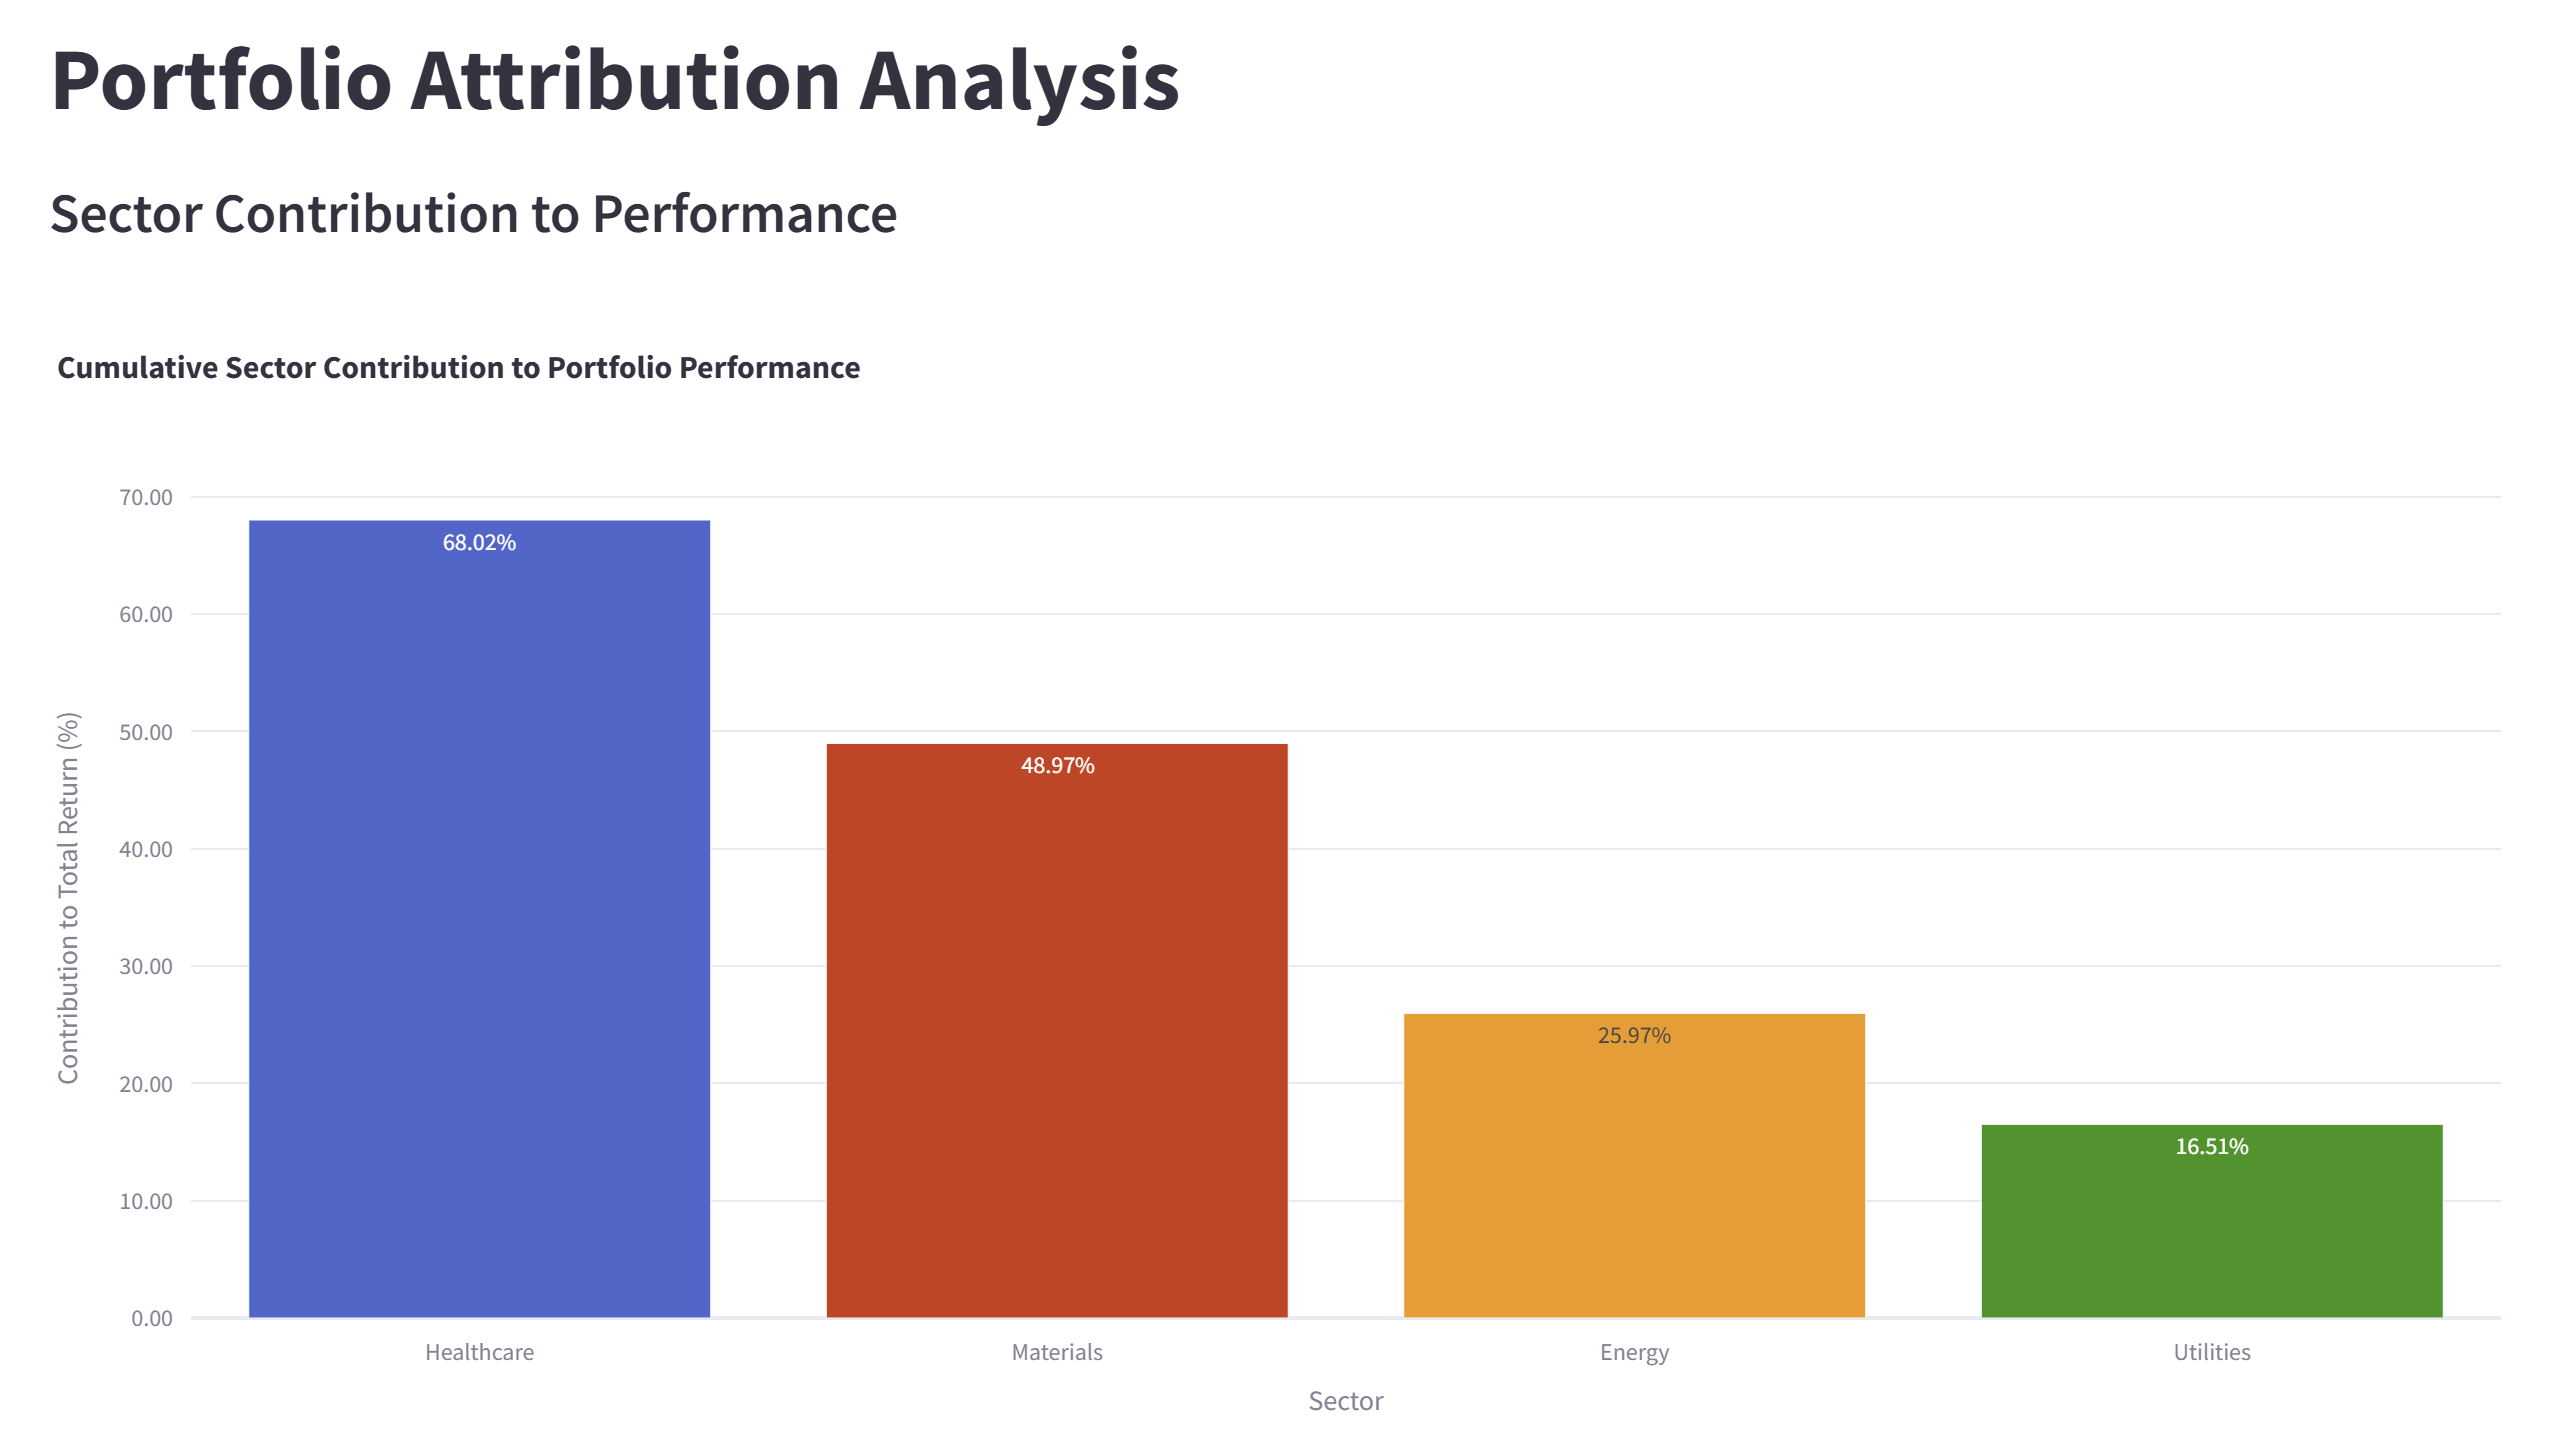
The dashboard delivers comprehensive attribution analysis, clearly showing sector contributions over time and via intuitive heatmaps. Investment opportunity screening is enhanced with sector analysis, correlation matrices, deep company analysis including scoring and DCF valuation, and comparable company assessments. We tackle NAV challenges head-on with dedicated tracking and reconciliation features. Portfolio performance is tracked meticulously against benchmarks, alongside risk-adjusted metrics like Alpha. Furthermore, detailed investment portfolio risk analysis covers distributions, allocations, standard metrics like volatility and Sharpe ratio, and factor exposure, providing a holistic view essential for modern RegTech for asset management. This unified view simplifies operations and supports automated investment compliance reporting solution requirements.

Quantifiable Gains: The Business Impact
Adopting this integrated approach yields significant, measurable benefits. Firms can slash the 30-40% of investment team time typically lost to data wrangling, redirecting highly compensated analysts away from low-value tasks. By accelerating performance attribution analysis, decision latency shrinks from days to hours, potentially preserving 50-150 basis points in annual returns otherwise lost to delayed reactions.
The automation inherent in the platform drastically reduces the 2-4% error rates common in manual NAV calculations, bolstering accuracy and client confidence. Operational budgets see relief as compliance reporting efficiency improves, cutting down the 15-20% typically consumed by these tasks. Ultimately, enhanced reporting quality directly impacts client retention, a key factor for 68% of institutional investors, while faster screening prevents missing the 15-20% of viable opportunities often lost in dynamic markets.
See the Future of Investment Analytics: Your Next Step
Experiencing the demo is the most effective way to understand how this managed solution transforms chaotic data into actionable intelligence. Witness firsthand how automated workflows eliminate manual bottlenecks in reconciliation and reporting. See how integrated attribution, screening, and risk tools empower faster, more informed investment decisions, directly addressing the challenges in investment performance attribution analysis.
Explore visualizations that clarify complex relationships and enhance stakeholder communication. Understand how a unified platform can mitigate performance attribution calculation errors and provide a clear path towards regulatory readiness. Step away from the spreadsheet madness and see what integrated analytics truly looks like. Why drown in data when you could be surfing the insights?
Request Your Free Proof of Concept
Stop letting fragmented data dictate your performance. Contact us today for a free Proof of Concept (PoC) using your own data. See exactly how our managed unified investment analytics platform can solve your specific challenges.
By submitting this form, you agree that Finaprins may contact you occasionally via email to make you aware of Finaprins products and services. You may withdraw your consent at any time. For more details see the Finaprins Privacy Policy.
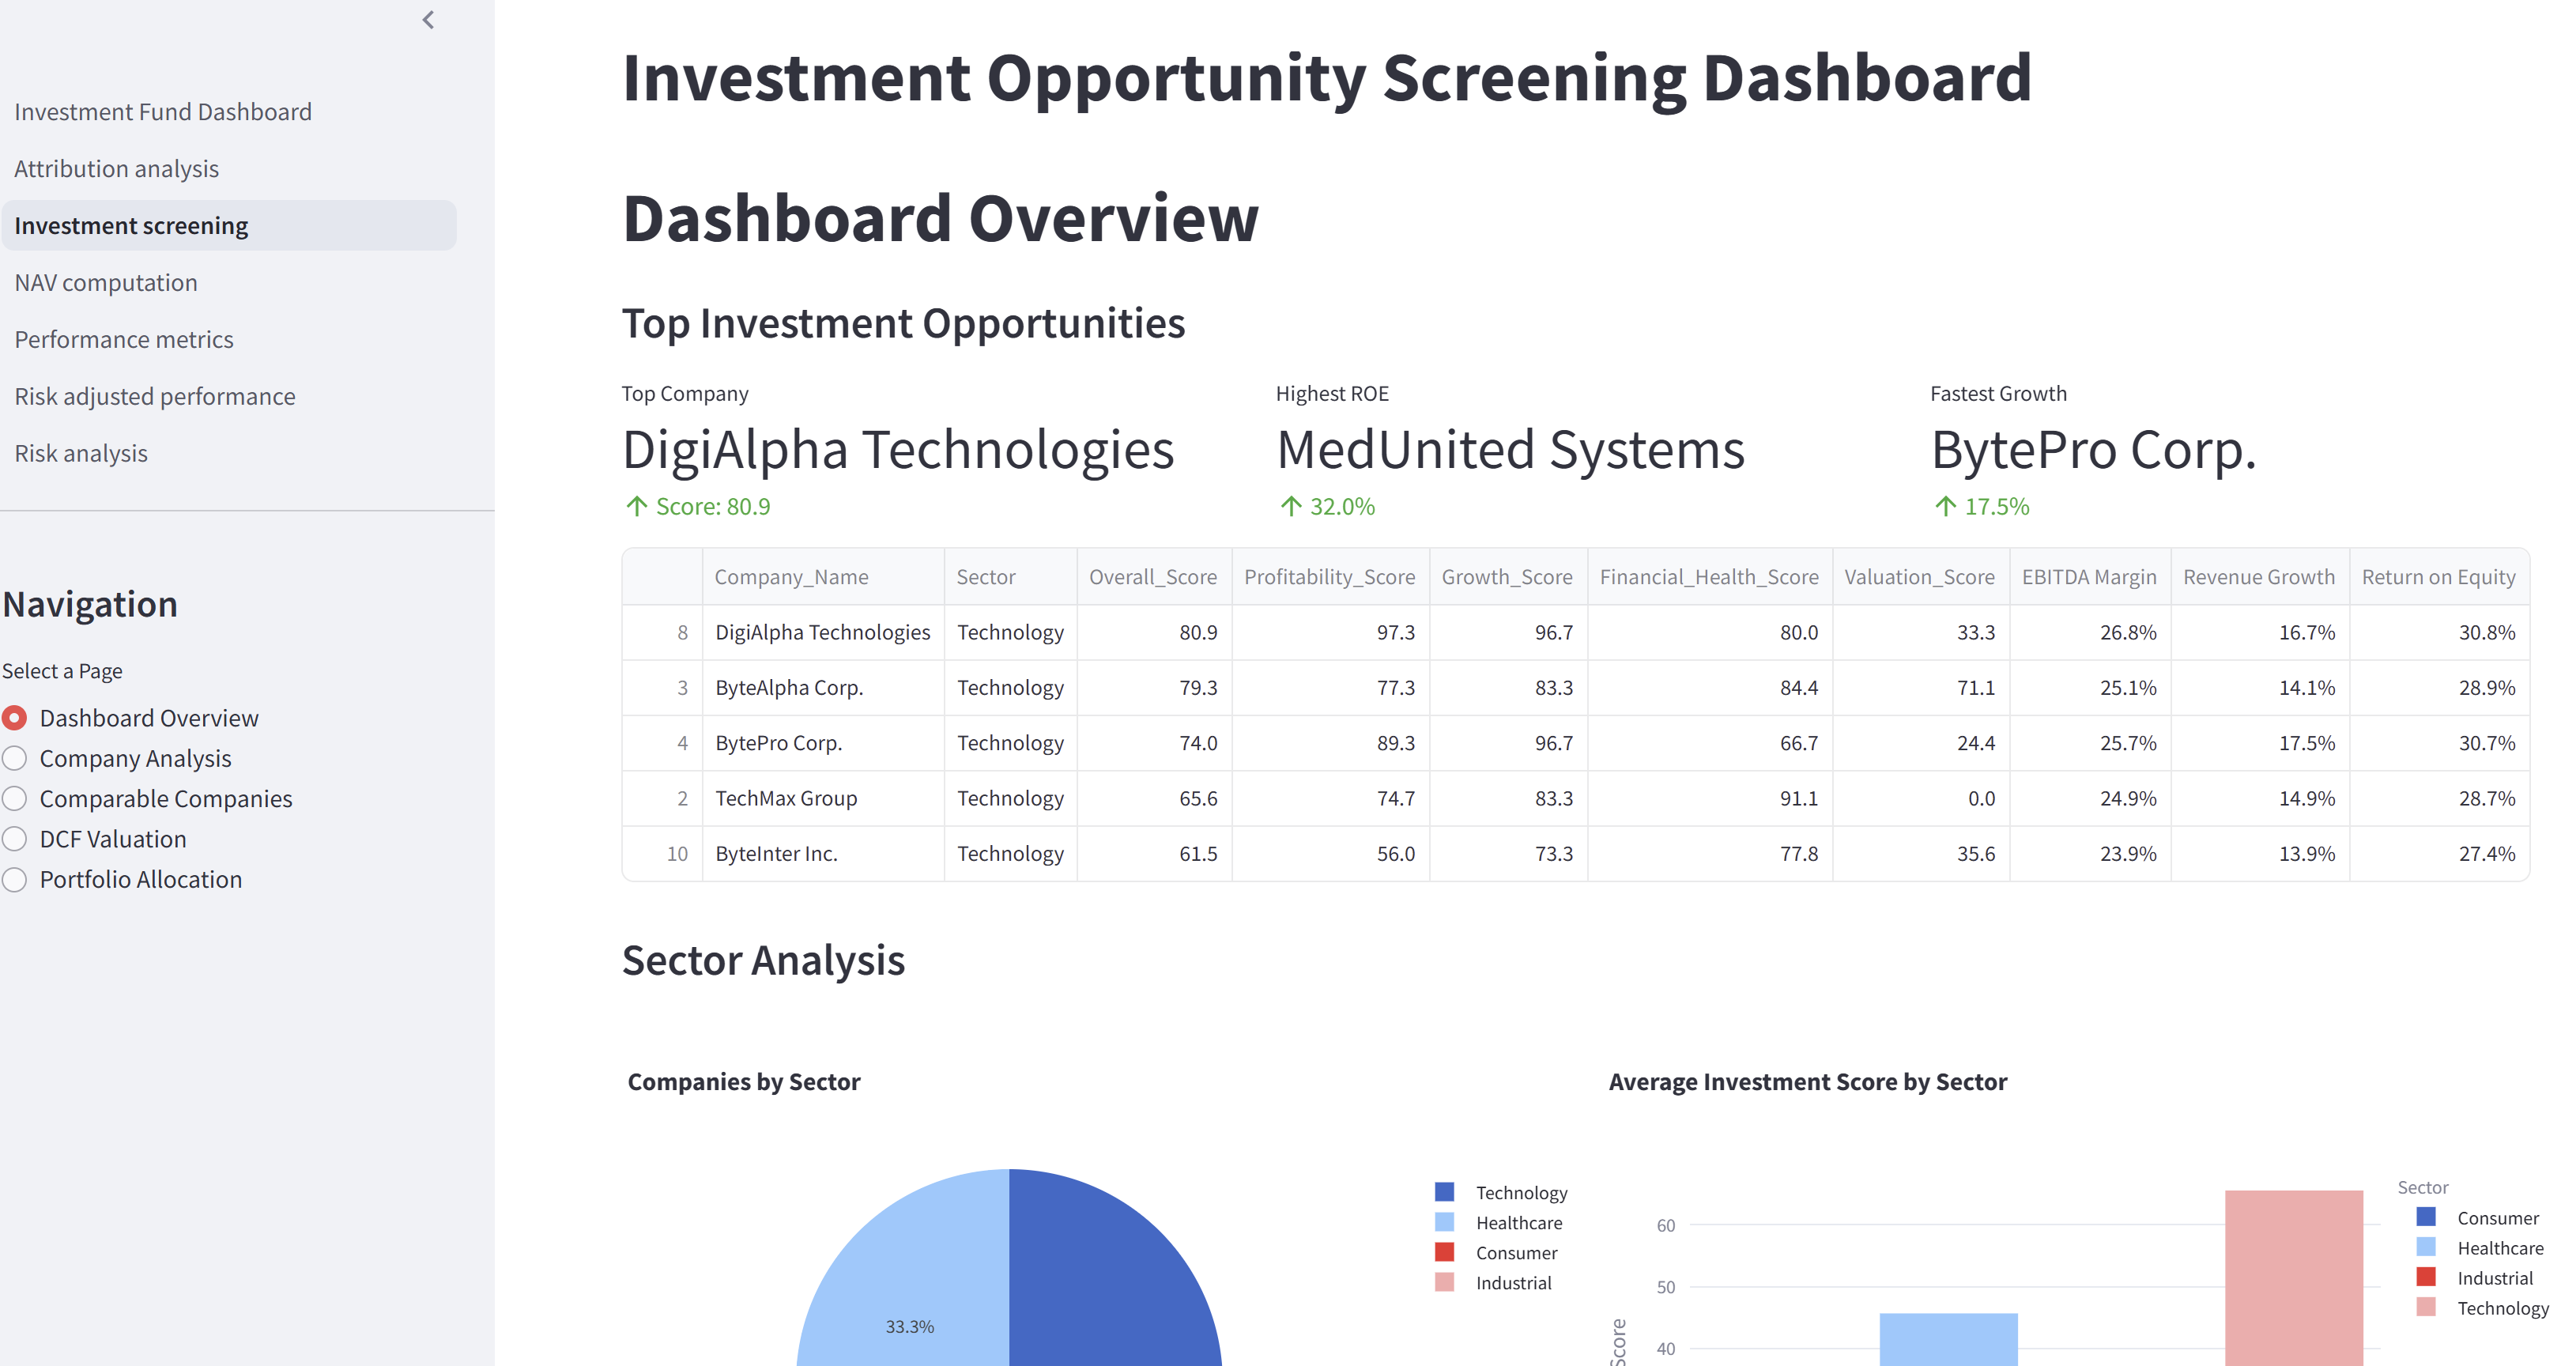
Photo by Andrea Cau on Unsplash